Four in ten Warren homes sold over asking this year, the winning bid ran a median $51,000 over, and the third quarter share slipped to 36 percent
49 of Warren's 120 home sales since January 1 closed over ask, 40.8 percent, at a median $51,000 premium. The third quarter share fell to 36.4 percent from 45.2.

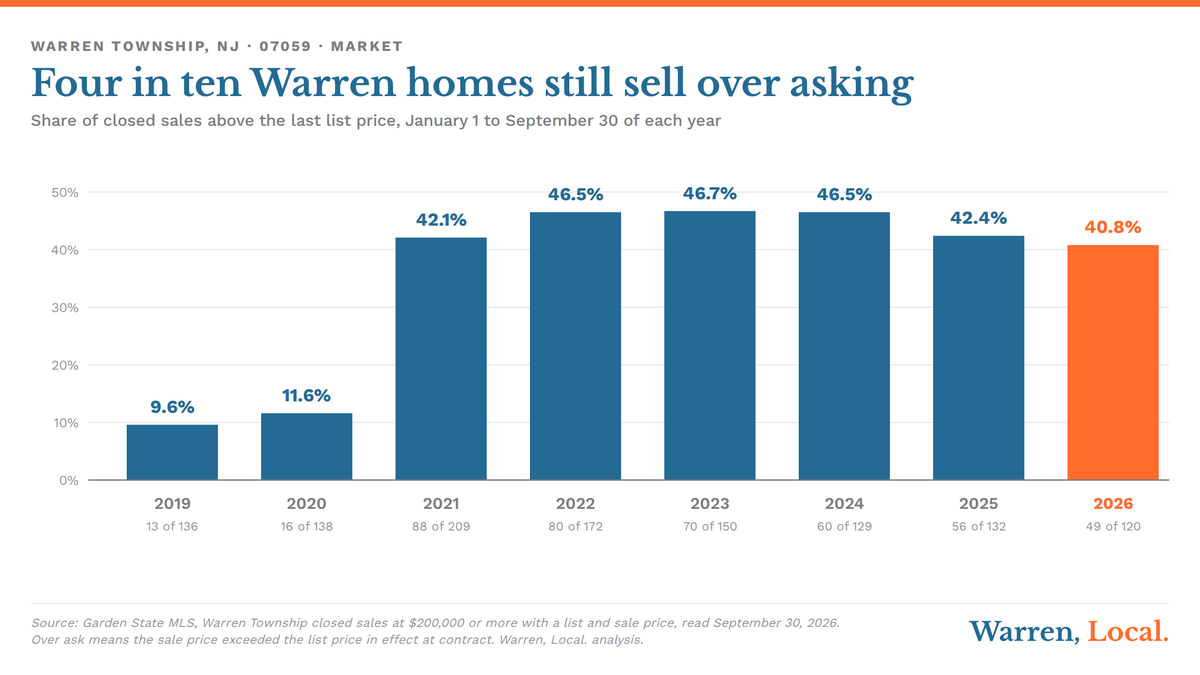
Forty nine of the 120 Warren Township homes that closed between January 1 and September 30, 2026 sold above their last asking price, 40.8 percent, against 56 of 132, 42.4 percent, in the same window of 2025. The share has held between 40.8 and 46.7 percent in every one of the last six years, after 9.6 percent in 2019 and 11.6 percent in 2020, so the count of bidding wars has barely moved. The size of the winning bid has. The median over ask sale closed $51,000 over its list price, 5.1 percent, against $56,000 and 6.2 percent a year ago, and the top quarter of premiums now starts at 8.6 percent instead of 10.1. Homes that drew a premium went under contract in a median 15 days. Homes that sold under ask took 49. In the third quarter the share slipped to 16 of 44 sales, 36.4 percent, from 28 of 62 a year earlier, with September's last closings still arriving.
Six years of bidding wars in one table
| Year, January 1 to September 30 | Sales | Over ask | At ask | Under ask | Share over ask | Median premium, over ask sales | Days on market, over ask | Days on market, under ask |
|---|---|---|---|---|---|---|---|---|
| 2019 | 136 | 13 | 14 | 109 | 9.6% | $11,000, 1.8% | 28 | 62 |
| 2020 | 138 | 16 | 11 | 111 | 11.6% | $5,000, 0.6% | 27 | 41 |
| 2021 | 209 | 88 | 20 | 101 | 42.1% | $25,000, 2.8% | 15 | 38 |
| 2022 | 172 | 80 | 25 | 67 | 46.5% | $32,815, 4.3% | 13 | 45 |
| 2023 | 150 | 70 | 26 | 54 | 46.7% | $28,500, 3.5% | 14 | 45 |
| 2024 | 129 | 60 | 18 | 51 | 46.5% | $58,000, 5.1% | 14 | 51 |
| 2025 | 132 | 56 | 15 | 61 | 42.4% | $56,000, 6.2% | 13 | 52 |
| 2026 | 120 | 49 | 14 | 57 | 40.8% | $51,000, 5.1% | 15 | 49 |
The table covers Warren Township sales recorded in the Garden State MLS that closed between January 1 and September 30 of each year at $200,000 or more, with a list price and a sale price on the record. Over ask means the sale price was higher than the list price in effect when the contract was signed, not the price the home first came on at. The line that matters runs down the sixth column. Warren went from one sale in ten closing over ask in 2019 and 2020 to four or five in ten from 2021 on, and it has not come back. The 2026 share, 40.8 percent, is the lowest of the six years since the shift, but on a base of 120 sales it sits two over ask sales short of the 2025 share, and two sales the other way would put the years level. Read it as flat. What the table also shows is that the median Warren sale has closed at exactly its list price in every year since 2021. In 2019 and 2020 the median sale closed at 97 percent of ask.
The days on market columns explain what an over ask sale is. In 2026 the 49 homes that sold over ask went under contract in a median 15 days, and 38 of them within three weeks. The 57 that sold under ask took a median 49 days, and 26 of them took more than 60. The 14 that sold at exactly their ask took 21. The premium is not a separate market. It is what happens to a listing that draws more than one buyer in its first two weekends, and the discount is what happens to a listing that does not, which is the same split the price cut post found in August from the other direction.
The premium is what changed
| Measure, January 1 to September 30 | 2026 | 2025 |
|---|---|---|
| Sales in the set | 120 | 132 |
| Closed over ask | 49, 40.8% | 56, 42.4% |
| Closed at ask | 14, 11.7% | 15, 11.4% |
| Closed under ask | 57, 47.5% | 61, 46.2% |
| Median premium, over ask sales | $51,000, 5.1% | $56,000, 6.2% |
| Premium, 25th to 75th percentile | 1.8% to 8.6% | 3.4% to 10.1% |
| Sales 5 percent or more over ask | 25 | 33 |
| Sales 10 percent or more over ask | 11 | 15 |
| Largest premium in the set | 37.5% | 38.5% |
| Dollars paid above ask, all over ask sales | $3,476,900 | $4,702,634 |
| Dollars conceded below ask, all under ask sales | $2,966,938 | $4,451,263 |
| Net, sale price minus last ask, every sale | $509,962 | $251,371 |
| Median discount, under ask sales | $35,000, 3.1% | $40,942, 3.8% |
| Median sale price, over ask sales | $1,175,000 | $1,190,000 |
| Median sale price, under ask sales | $1,230,000 | $1,160,000 |
| Over ask sales that had cut the price first | 1 | 3 |
| Under ask sales that had cut the price first | 18 | 19 |
Every row of the premium moved down. The median over ask sale in 2026 closed $51,000 over its list price against $56,000 in 2025, the low end of the middle half of premiums fell from 3.4 percent to 1.8, the high end fell from 10.1 percent to 8.6, and the count of sales that cleared ask by 10 percent or more went from 15 to 11. Buyers paid $3,476,900 over ask across the 49 sales this year against $4,702,634 across 56 last year. The under ask side moved too. Sellers conceded $2,966,938 below their last ask across 57 sales against $4,451,263 across 61, and the median discount narrowed from 3.8 percent to 3.1. Add the two sides together and Warren's sellers as a group closed $509,962 above their final asking prices this year, against $251,371 last year. Smaller premiums, smaller discounts, and a median that sits on the ask: the market is pricing closer to where it clears from both directions.
Two of the rows are worth a second look. The homes that sold over ask this year were slightly cheaper than the ones that sold under it, a $1,175,000 median against $1,230,000, where last year the over ask sales were the dearer group. And the price cut rows say a cut almost never turns into a bidding war. One of the 49 over ask sales had reduced its price before the contract. Eighteen of the 57 under ask sales had. A listing that draws competing offers draws them at its first price.
Detached houses, townhouses and price bands
| Group, January 1 to September 30 | 2026 sales | 2026 over ask | 2025 sales | 2025 over ask |
|---|---|---|---|---|
| Detached houses | 99 | 45, 45.5% | 105 | 52, 49.5% |
| Townhouses and condominiums | 20 | 4, 20.0% | 24 | 2, 8.3% |
| Under $1,000,000 | 51 | 21, 41.2% | 52 | 22, 42.3% |
| $1,000,000 to $1,499,999 | 39 | 19, 48.7% | 42 | 15, 35.7% |
| $1,500,000 to $1,999,999 | 17 | 5, 29.4% | 28 | 15, 53.6% |
| $2,000,000 and up | 13 | 4, 30.8% | 10 | 4, 40.0% |
Detached houses carry the premium. Forty five of the 99 detached sales this year closed over ask, 45.5 percent, at a median premium of $55,000, 5.6 percent, and the median detached sale closed at exactly 100 percent of its last ask. Four of the 20 townhouse and condominium sales closed over ask, and the median attached sale closed at 97.6 percent of ask, up from 94.9 percent in the 2025 window, when two of 24 cleared the ask. One 2026 sale and three 2025 sales carry no property type in the record and sit in the totals but not in these two rows. The detached and attached split published in September has the price gap between the two.
By price band the competition moved down a rung. Between $1,000,000 and $1,499,999, 19 of 39 sales closed over ask, 48.7 percent, against 15 of 42 a year ago, the only band where the share rose. Between $1,500,000 and $1,999,999 it fell from 15 of 28, 53.6 percent, to 5 of 17, 29.4 percent, and the band sold 11 fewer homes. Under $1,000,000 the share held at four in ten. At $2,000,000 and up, 4 of 13 closed over ask against 4 of 10. The band counts are small, 13 and 17 sales in the upper two, so a single closing moves the percentage by six to eight points, and the direction is the finding, not the decimals. The price bands post in August found the middle of the market the most contested, and this year's over ask record agrees.
Quarter by quarter
| Quarter | Sales | Over ask | Share |
|---|---|---|---|
| January to March 2025 | 26 | 9 | 34.6% |
| April to June 2025 | 44 | 19 | 43.2% |
| July to September 2025 | 62 | 28 | 45.2% |
| January to March 2026 | 40 | 16 | 40.0% |
| April to June 2026 | 36 | 17 | 47.2% |
| July to September 2026, closings recorded through September 24 | 44 | 16 | 36.4% |
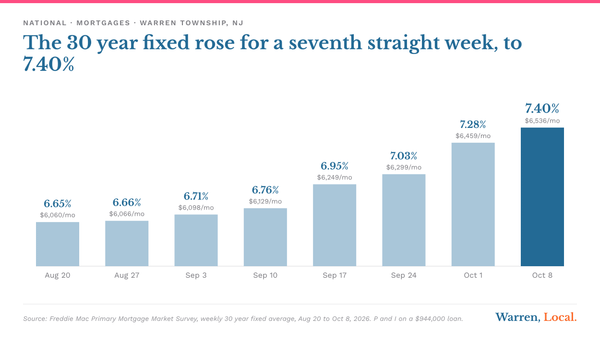
The third quarter is where the year's number was set. The share ran 40.0 percent in the first quarter and 47.2 percent in the second, both at or above the same quarter of 2025, then fell to 36.4 percent in the third, 16 of 44 sales, against 45.2 percent, 28 of 62, in the third quarter of 2025. The 2025 quarter is complete. The 2026 quarter is not: the most recent closing in the record is September 24, and last week's third quarter post counted 15 pending sales dated to close by September 30, so the 44 will grow and the share can move a few points either way. The quarter also ran into the rate move. Freddie Mac's 30 year fixed printed 7.03 percent on September 24, the first weekly average above 7 percent since January 2025, after five straight weekly increases, and a sale closing in September was under contract in July or August, so the September contracts, not the September closings, are where any rate effect will show first. The record cannot yet say whether it will.
My read
This section is the author's opinion, kept apart from the record above.
The headline number, four in ten, has been the same for six years, and I would not read this year's 40.8 percent as the start of a decline. The number I would read is the premium. When the median winning bid falls from 6.2 percent over ask to 5.1, and the top quarter of premiums from 10.1 percent to 8.6, buyers are still competing but they are competing with less margin, and the sellers who priced above the market are conceding less because they are conceding from a lower starting point. Both sides are closer to the clearing price than they were a year ago. That is a healthier market than the 2021 version, when 42 percent of sales cleared ask by a median of only $25,000 because list prices had not caught up.
For a seller the practical part is the days on market split, and it has not changed in six years. The homes that sell over ask sell in two weeks, at the first price. The homes that sell under ask take seven weeks and often a price cut on the way. A Warren listing has one opening, its first two weekends, and the price it carries into them decides which of the two columns it lands in. The listing month post has the seasonal side of that, and the selling guide carries the pricing record in one place.
All figures come from Garden State MLS records for Warren Township, Somerset County, read September 30, 2026, filtered to exclude superseded listing records. The most recent closing in the record is September 24, 2026, which is the last recorded closing and not the date the record was refreshed. Warren Township is in Somerset County and is not Warren County. Every window runs from January 1 to September 30 of its year, so the years compare like with like, and the 2026 third quarter figures are partial until the last September closings are entered. Sales under $200,000 are excluded throughout as likely non arms length transfers, the floor the selling guide applies and the market page does not, which is why counts differ between pages. One 2026 sale and two 2025 sales sat below that floor or lacked a price. Over ask, at ask and under ask compare the sale price with the list price in effect when the contract was signed, so a home that cut its price and then sold above the reduced figure counts as over ask, and the price cut rows use the original list price on the record to identify those cases. Days on market count the current listing only, as the MLS records them. Premiums and discounts are percentages of the last list price. Medians in an even count are the midpoint of the two middle sales, dollar figures are whole dollars and median days are rounded to whole days. Detached and attached follow the MLS property type, single family or condominium, co-op and townhouse. These figures cover every residential property type in the MLS, including townhouses and condominiums, not detached houses alone. Attached product sells below detached in Warren, so a detached only median would run higher.
How many offers each over ask sale drew. The MLS records the sale price and the list price, not the number of bids, so a sale $5,000 over ask and a sale $200,000 over ask each count once here. Whether any premium reflects a seller concession, a credit or an appraisal gap agreement, none of which the sale price field shows. Whether the 15 pending September sales will close over or under ask, which the record only shows after they close. And whether the September rate move changed what buyers offered, since the contracts signed after September 24 have not closed and are not in this set.
Figures are deemed reliable but are not warranted. Nothing here is a valuation of any particular property.
- Garden State MLS records for Warren Township, Somerset County, closed sales from January 1, 2019 to September 30, 2026, read September 30, 2026. https://www.gsmls.com
- Warren, Local., third quarter closings and contracts, September 23, 2026, the pending sales dated to close by September 30. https://blog.johnmangini.com/warren-third-quarter-closings-contracts/
- Warren, Local., mortgage rates crossed 7 percent, September 25, 2026, citing the Freddie Mac Primary Mortgage Market Survey of September 24, 2026. https://blog.johnmangini.com/rates-cross-7-percent-warren-payment/
- Freddie Mac Primary Mortgage Market Survey, the weekly 30 year fixed average. https://www.freddiemac.com/pmms
- Warren, Local., the price cut post, August 26, 2026, days on market with and without a price reduction. https://blog.johnmangini.com/warren-price-cuts-96-days/
- Warren, Local., Warren's price bands, August 20, 2026. https://blog.johnmangini.com/warren-price-bands/
- Warren, Local., the detached and attached split, September 2, 2026. https://blog.johnmangini.com/warren-detached-attached-split/
- Warren, Local., when to list in Warren, August 20, 2026, sale to list ratio by listing month. https://blog.johnmangini.com/when-to-list-in-warren/
- Warren, Local., the Warren real estate market page, trailing twelve month figures with no price floor. https://blog.johnmangini.com/warren-real-estate-market/
- Warren, Local., selling a home in Warren, by the numbers, where the $200,000 floor is set out. https://blog.johnmangini.com/selling-a-home-in-warren/
Thinking about selling a Warren home?
Get a property specific analysis built from the same Warren sales database behind this article.
Request a Warren home analysis or call 732.236.1087
Start with what seven years of Warren data says about selling.

John Mangini
Broker / Owner, NextHome Premier

Warren Township resident and full time broker, licensed in New Jersey since 2002. Warren, Local. is written from live Garden State MLS data, township records and primary sources. Every figure is traceable to a source listed above.