Warren homes listed in March and April sell fastest, and March clears ask most often
Across 1,512 Warren listings since 2019, March launches sold in 19 days with 57.4 percent at or over ask. November launches took 47 days at 97.1 percent.

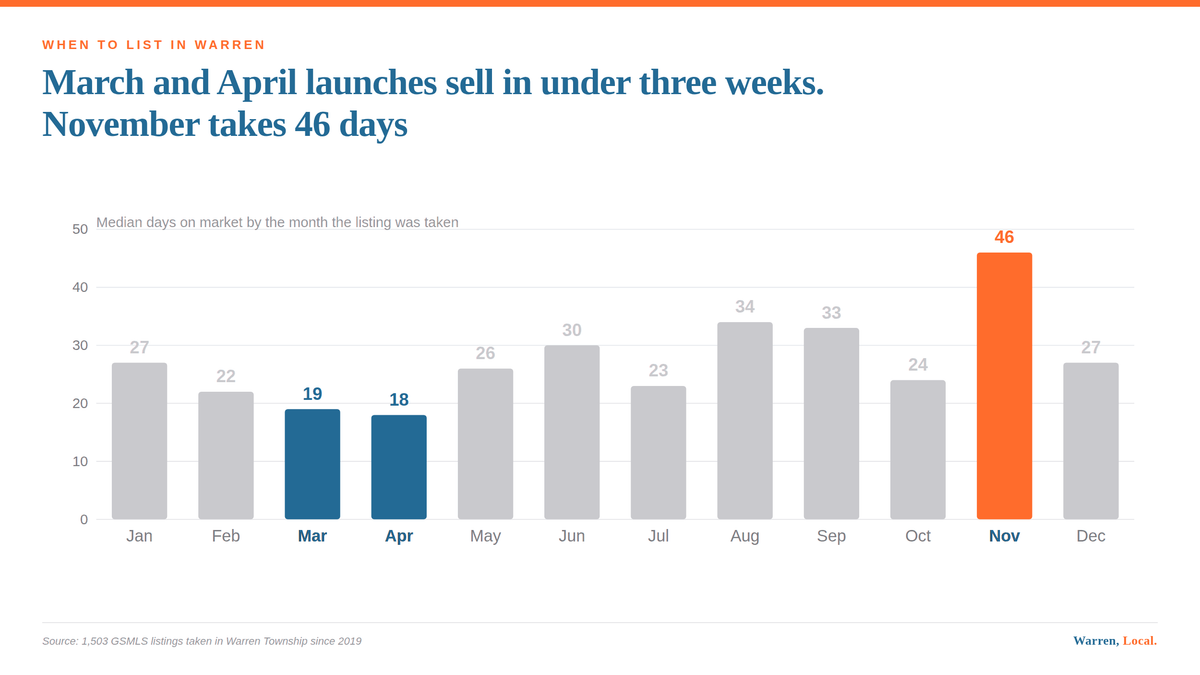
This story updates the market tape, the running file that carries the current status.
In Warren Township, New Jersey, homes listed in March and April sell fastest and closest to ask. Across 1,512 listings taken since 2019 that went on to close, March launches had a median of 19 days on market and 57.4 percent closed at or above asking price. April launches had 19 days and 50.8 percent. November was the worst month by a wide margin at 47 days and 97.1 percent of ask, with only 26.8 percent clearing asking price. The spread between the best and worst launch month is roughly three percent of sale price.
Sellers spend real money getting a house ready and then choose the launch date around a vacation. The data says the launch date is the bigger lever.
This is every Warren listing taken since January 2019 that went on to close, 1,512 of them, grouped by the month the listing was taken rather than the month it closed. Grouping by list month is the point. It answers the question a seller actually asks, which is when to go on the market.
| Listing month | Listings | Median DOM | Sale to list | Share at or over ask |
|---|---|---|---|---|
| January | 87 | 27 | 98.9% | 43.7% |
| February | 103 | 22 | 100.0% | 51.5% |
| March | 162 | 19 | 100.0% | 57.4% |
| April | 179 | 19 | 100.0% | 50.8% |
| May | 184 | 27 | 98.8% | 43.5% |
| June | 182 | 30 | 99.3% | 47.8% |
| July | 139 | 23 | 98.0% | 42.4% |
| August | 105 | 34 | 98.3% | 43.8% |
| September | 118 | 34 | 99.2% | 43.2% |
| October | 112 | 24 | 98.5% | 43.8% |
| November | 82 | 47 | 97.1% | 26.8% |
| December | 59 | 27 | 100.0% | 54.2% |
The spring window is narrower than people think
The conventional advice is to list in spring. The data supports it, but only barely, and only for a specific eight weeks.
March and April are the two clear winners. Median days on market of 19 and 18, the two fastest months of the year, and March carries the highest share of homes clearing asking price. April is the only month with a sale to list ratio above 100 percent other than December.
Then it stops. May is already worse than April on every measure, at 27 days against 19, and 43.5 percent clearing ask against 50.8. June is worse than May on time and on sale to list ratio. The premium is not "spring," it is the first two months of it.
Warren's own listing volume tells you why. March through June carry 162, 179, 184 and 182 listings, the four heaviest months of the year. By May a seller is competing with the largest pool of comparable inventory Warren produces. In March that pool is still forming.
November is the month to avoid
Every measure lands at the bottom in November. Forty seven days on market, more than double April. A sale to list ratio of 97.1 percent, the only month below 98. And 26.8 percent clearing ask, against 57.4 percent in March.
On a $1.2 million house, the gap between April's 100.0 percent and November's 97.1 percent is roughly $35,000 of negotiated price. That is a larger number than most pre listing renovation budgets.
The plausible mechanism is not that buyers disappear in November. It is that a November listing runs into the holidays before it has had time to work, then carries accumulated days on market into January, when buyers read a high day count as a problem with the house.
December is the strange one, and the sample is small
December shows a 100.0 percent sale to list ratio and 54.2 percent clearing ask, the second highest share clearing ask in the table, behind March. Treat that with caution. December has the smallest sample in the set at 59 listings, roughly a third of April's.
The likely explanation is selection rather than seasonality. Very few Warren sellers list in December, and the ones who do tend to have a specific reason, often a relocation with a real deadline and a property that does not need a long marketing runway. That is a different population of houses, not evidence that December is a good time to launch.
What this does not tell you
This is seven and a half years of Warren history pooled together, which means it blends the 2019 market, the 2021 surge and the current thinner market into one set of monthly averages. A month that looked good in 2021 and bad in 2019 shows up as average.
It also cannot tell you what any specific month next year will do. It is a base rate, and base rates are useful precisely because they are not predictions. If you have flexibility on timing, the record says use it to be on the market by early April. If you do not have flexibility, the record says November needs a more careful pricing decision than August does.
The full Warren Housing Index and its construction rules are on the index page.
These figures cover every residential property type in the MLS, including townhouses and condominiums, not detached houses alone. Attached product sells below detached in Warren, so a detached only median would run higher.
The table and figures on this page were recomputed after the August 21 data refresh. The sample moved from 1,503 to 1,512 listings, April's median sale to list moved from 100.6 to 100.0 percent, and the April to November spread narrowed from 4.2 to 2.9 points. March remains the strongest launch month on both speed and the share clearing ask. A follow up pass on August 24 synced the remaining prose to the refreshed table. April now reads 19 days and 50.8 percent, May 27 days and 43.5 percent, December 100.0 percent sale to list, the best to worst spread 2.9 points, and the spring volume figures match the table.
- Garden State MLS closed sales, Warren Township (Somerset County), 1,512 listings taken between January 1, 2019 and June 30, 2026 that subsequently closed, grouped by the month the listing was taken, queried via BigQuery view v_gsmls_enriched
Thinking about selling a Warren home?
Get a property specific analysis built from the same Warren sales database behind this article.
Request a Warren home analysis or call 732.236.1087
Start with what seven years of Warren data says about selling.

John Mangini
Broker / Owner, NextHome Premier

Warren Township resident and full time broker, licensed in New Jersey since 2002. Warren, Local. is written from live Garden State MLS data, township records and primary sources. Every figure is traceable to a source listed above.