Strip out the townhouses and Warren's median is $1,300,000
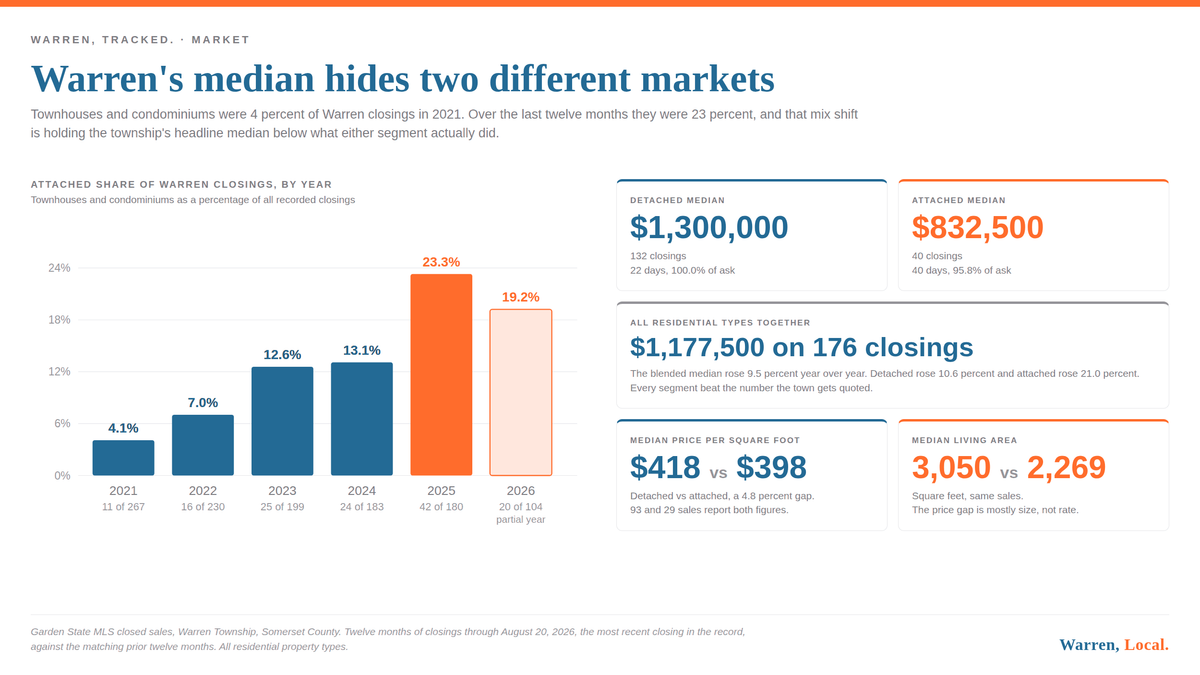
Warren's blended median is $1,177,500. Detached alone ran $1,300,000 on 132 sales and attached $832,500 on 40. Both segments rose faster than the blend.

This story updates the market tape, the running file that carries the current status.
Warren Township recorded 176 residential closings in the twelve months through August 20, 2026, at a median of $1,177,500. Split by property type, the detached houses came in at a median of $1,300,000 on 132 sales and the townhouses and condominiums at $832,500 on 40. The blended median rose 9.5 percent against the matching prior twelve months. Detached rose 10.6 percent and attached rose 21.0 percent, so both segments beat the number the township gets quoted. The blend is lower because attached homes went from 17.8 percent of Warren closings to 22.7 percent, and a cheaper mix pulls a median down even when nothing gets cheaper.
Every Warren market figure this site publishes carries the same sentence at the bottom, which is that the numbers cover every residential property type in the MLS. This post is the one that breaks that sentence open and shows you what sits underneath it.
The reason it matters more than it used to is in the mix. Warren was a detached house town almost to the exclusion of anything else. It is still mostly that, but attached product is now roughly a fifth to a quarter of what closes here, and the township's headline median has started to reflect the composition of the buyer pool as much as the price of a house.
The three segments, last twelve months
These are closings recorded between August 21, 2025 and August 20, 2026. August 20 is the most recent closing in the record, not the date the data was last refreshed. No price floor is applied here, which is why the totals match the figures on Warren by the Numbers. One attached sale closed below $200,000 and is included.
| Segment | Closings | Share | Median sale | Median days | Median % of ask |
|---|---|---|---|---|---|
| Detached houses | 132 | 75.0% | $1,300,000 | 22 | 100.0% |
| Townhouses and condominiums | 40 | 22.7% | $832,500 | 40 | 95.8% |
| Type not recorded | 4 | 2.3% | $624,500 | 57 | 94.9% |
| All residential types | 176 | 100% | $1,177,500 | 24 | 99.5% |
The detached median sits $122,500 above the published all types median. If someone tells you the typical Warren house trades around $1.18 million and you are shopping for a detached house on a lot, the number you should be working from is closer to $1.3 million.
The two segments also behave differently at the table. Detached closings ran a median of exactly 100.0 percent of the last asking price and took 22 days. Attached closings ran 95.8 percent and took 40 days. That is a real negotiating gap, and it is the opposite of what most people assume about the cheaper end of a town like this. It lines up with what the record showed about price cuts and time on market earlier this month.
Year over year, both segments rose faster than the blend
Same window against the same window a year earlier, August 21, 2024 through August 20, 2025.
| Segment | Prior 12 mo | Last 12 mo | Change | Closings, prior to last |
|---|---|---|---|---|
| Detached houses | $1,175,000 | $1,300,000 | +10.6% | 146 to 132 |
| Townhouses and condominiums | $688,000 | $832,500 | +21.0% | 33 to 40 |
| All residential types | $1,075,000 | $1,177,500 | +9.5% | 185 to 176 |
Read the bottom row against the two above it. The all types median rose 9.5 percent. Detached rose 10.6 percent and attached rose 21.0 percent. There is no third segment that fell to drag the blend below both of its parts. The arithmetic works because the composition changed: attached closings went up by seven while detached closings went down by fourteen, so a cheaper category took a larger slice of a smaller total.
A median is the middle sale, so it moves when the order of the sales changes, not only when prices change. Add seven attached sales in the $700,000 to $900,000 range and remove fourteen detached sales above $1 million, and the middle of the list slides down the price ladder even if every individual house sold for more than its equivalent did a year ago. That is what happened in Warren over the last twelve months.
The mix shift is five years old, not a blip
Attached closings as a share of all recorded Warren closings, by calendar year. 2026 runs through August 20 and is a partial year.
| Year | All closings | Attached | Attached share |
|---|---|---|---|
| 2021 | 267 | 11 | 4.1% |
| 2022 | 230 | 16 | 7.0% |
| 2023 | 199 | 25 | 12.6% |
| 2024 | 183 | 24 | 13.1% |
| 2025 | 180 | 42 | 23.3% |
| 2026 to Aug 20 | 104 | 20 | 19.2% |
Attached went from one closing in twenty five to roughly one in five over five years. Total closings fell over the same stretch, from 267 in 2021 to 180 in 2025, so the share moved for two reasons at once. More attached homes traded and fewer detached ones did. What the MLS record shows is the trade activity, not the reason for it, and the record on its own does not tell you whether that is downsizing, first purchases, investors, or new units reaching the resale market.
Per square foot, the two segments are close
This is the finding that surprised me. Warren's attached homes do not sell at a discount per square foot that is anywhere near the discount on the sticker.
| Segment | Median price per sq ft | Median living area | Sales reporting both |
|---|---|---|---|
| Detached houses | $418 | 3,050 sq ft | 93 |
| Townhouses and condominiums | $398 | 2,269 sq ft | 29 |
Twenty dollars a foot apart, or 4.8 percent of the detached figure, against a $467,500 gap in the median sale price. The living area medians explain most of it. The attached homes that closed here are about 780 square feet smaller at the middle. Buyers in Warren are not paying much less per foot for attached product. They are buying fewer feet, and usually less land with them.
Both figures use the broader living area basis, which takes county parcel square footage where it exists and the MLS approximate square footage where it does not. The strict county parcel basis covers fewer of these sales and gives a different answer, which is why the count of sales behind each figure is printed next to it. The method is spelled out on the data and methodology page.
What is on the market right now does not match what sold
As of this cut, Warren had 29 active listings and 28 under contract. Of the 29 active, 21 are detached at a median asking price of $1,739,000, five are attached at a median ask of $899,000, and three carry no recorded type at a median ask of $985,000. Of the 28 under contract, 25 are detached and three are attached.
So attached homes were 22.7 percent of the last twelve months of closings but are 17 percent of what is listed today and about 11 percent of what is under contract. Those are small counts and a month of listing activity could reverse them, but if you have been waiting for a Warren townhouse to come up, the current shelf is thinner than the sales record would suggest. The price band breakdown and the Warren Housing Index (WRNX) both cover all types together, so read them with this split in mind.
These figures cover every residential property type in the MLS, including townhouses and condominiums, not detached houses alone. Attached product sells below detached in Warren, so a detached only median would run higher. That is exactly what the $1,300,000 figure in this post is. Property type comes from the MLS sub property type field, where SinglFam is treated as detached and CCT as attached. Four closings in the last twelve months carry no value in that field and are reported in their own row rather than assigned to either segment. Medians use PERCENTILE_CONT on the full set, not an approximation. Price per square foot excludes anything below $50 or above $1,500 per foot and anything under 400 square feet.
The most recent closing in this data is August 20, 2026, so sales that closed in the final eleven days of August are not counted here and will move the August and twelve month figures when they land. The percent of ask figures are measured against the last asking price recorded in the feed, and this view does not let me separate builder base prices on attached units from ordinary resale asking prices, which could pull the 95.8 percent figure in either direction. I also cannot tell you from the MLS who the attached buyers are or why the mix moved, only that it did.
My read on it
This section is opinion and is separate from the figures above. I think the useful takeaway for a Warren owner is that the town's quoted median has become a weaker guide to your own house than it was five years ago, and it will keep getting weaker while the attached share climbs. If you own a detached house, the segment number is the one that describes your position, and it moved 10.6 percent in a year. If you own or want a townhouse, the segment is appreciating faster in percentage terms and negotiating harder at the table, which is an unusual combination and worth watching over the next few quarters rather than acting on from one twelve month cut.
If you want the arithmetic run against your own address rather than a segment, that is what the selling guide and a property specific analysis are for.
- Garden State MLS closed sales, Warren Township (Somerset County), 176 closings with close dates from August 21, 2025 through August 20, 2026 and 185 closings in the matching prior twelve months, queried via BigQuery view v_gsmls_enriched. No price floor applied. Method notes at https://blog.johnmangini.com/warren-data-and-methodology/
- Garden State MLS closed sales by calendar year, Warren Township, 2021 through August 20, 2026, same view. August 20, 2026 is the most recent recorded closing in the data, not the date of the last refresh.
- Garden State MLS active and under contract listings, Warren Township, as of September 2, 2026, same view.
- Warren price band analysis. https://blog.johnmangini.com/warren-price-bands/
- Warren Housing Index methodology and full series. https://blog.johnmangini.com/warren-housing-index/
Thinking about selling a Warren home?
Get a property specific analysis built from the same Warren sales database behind this article.
Request a Warren home analysis or call 732.236.1087
Start with what seven years of Warren data says about selling.

John Mangini
Broker / Owner, NextHome Premier

Warren Township resident and full time broker, licensed in New Jersey since 2002. Warren, Local. is written from live Garden State MLS data, township records and primary sources. Every figure is traceable to a source listed above.