Warren has a barbell problem, and the middle of the market is where the competition is
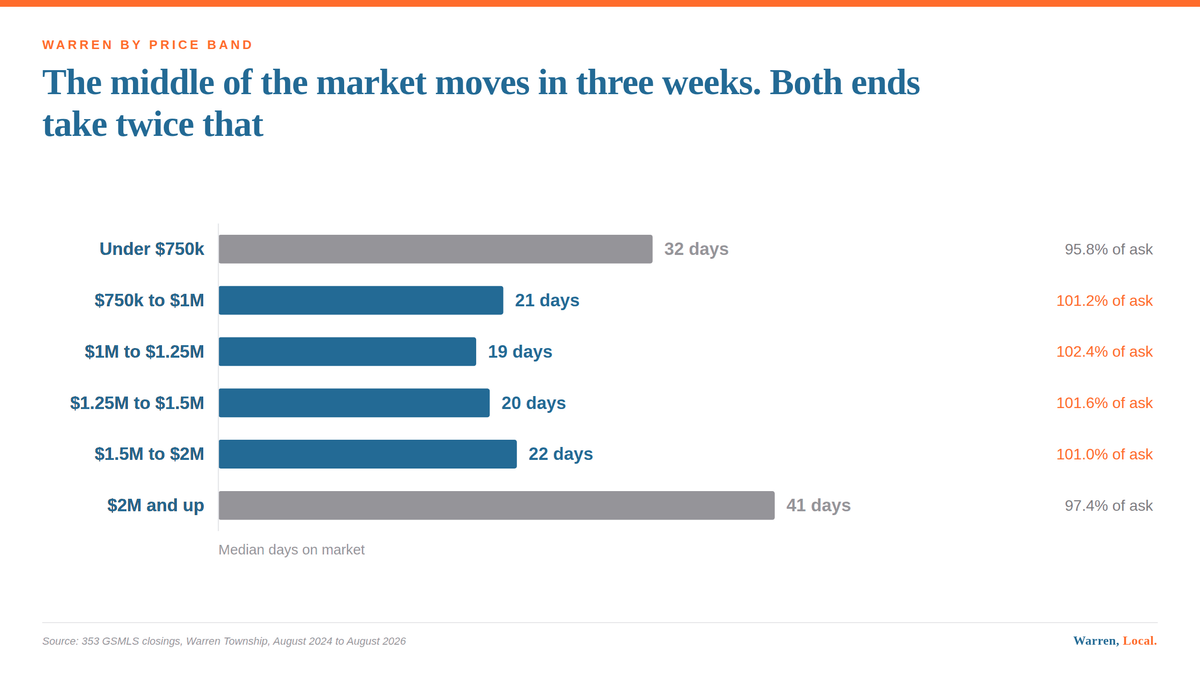
Across 364 Warren closings since August 2024, homes between $750,000 and $1.5 million sold in about three weeks at asking price. The ends took half again as long.

This story updates the market tape, the running file that carries the current status.
Across 364 Warren Township closings between August 2024 and August 2026, homes priced from $750,000 to $1.5 million sold at their asking price with a median of 19 to 21 days on market. Homes under $750,000 took a median of 32 days and closed at 96.2 percent of ask. Homes above $2 million took 30 days and closed at 98.5 percent. The pattern is a barbell, with soft ends and a competitive center.
Aggregate market statistics hide the thing sellers most want to know, which is whether their particular price range is the busy one. Over these two years in Warren, it usually was not the top.
Here is every Warren closing over the last two years, cut by price.
| Price band | Closings | Median DOM | Sale to list | Share at or over ask | Median $/sf |
|---|---|---|---|---|---|
| Under $750,000 | 79 | 32 | 96.2% | 24.1% | $407 |
| $750,000 to $1M | 88 | 21 | 100.0% | 46.6% | $377 |
| $1M to $1.25M | 47 | 19 | 100.0% | 40.4% | $416 |
| $1.25M to $1.5M | 57 | 20 | 100.0% | 40.4% | $423 |
| $1.5M to $2M | 57 | 22 | 100.0% | 42.1% | $384 |
| $2M and up | 36 | 30 | 98.5% | 25.0% | $465 |
The middle four bands behave like one market
From $750,000 to $2 million, the numbers barely move. Median days on market sits between 19 and 22. Sale to list ratio sits at asking price across all four of those bands. Roughly four in ten sales clear at or above the final asking price.
That is 249 of the 364 closings, or 68 percent of everything that traded. For most of Warren, the market is one thing, and that thing is quick and slightly competitive.
The tightest band on days is $1M to $1.25M, at a median of 19 days. That is also the thinnest band in the set at 47 closings, which means fewer choices for buyers who are looking there.
Both ends are slower, for opposite reasons
Under $750,000 is not a weak market so much as a different one. Warren's entry price point is heavily populated by attached and age restricted product rather than detached single family homes on land. Note the median price per square foot in that band, $407, which is higher than the $377 in the band directly above it. Small units carry a high per foot number and a low total, and they trade on a different clock than a house on an acre.
Above $2 million is a genuine thin market. Thirty six sales over 24 months works out to about one every three weeks. When the buyer pool for a property is measured in individuals rather than dozens, days on market lengthens and the last five percent of price becomes negotiable. The 98.5 percent sale to list ratio and the 25.0 percent share clearing ask both reflect that. So does the $465 median price per square foot, the highest in the table, because these are the largest and best finished houses in town.
What this means if you are pricing a house
The practical read is about which side of $750,000 and $2 million you land on.
A detached house that prices into the $750,000 to $1.5 million range enters the most liquid part of the Warren market, where the recent record shows quick absorption and frequent competition. A house that prices above $2 million enters a market with a small buyer pool where the exposure period is measured in months rather than weeks, and where the pricing decision carries more weight because there are fewer transactions to calibrate against.
Neither of those is a forecast. It is what the last 364 closings did.
A caveat on the bands themselves
Price band analysis has a built in circularity. A house sells for what it sells for, so the band it lands in is partly a result of how it was priced and how the negotiation went, not just what it is. A house listed at $2.1 million that closes at $1.95 million moves down a band and drags that band's sale to list ratio up.
The effect is real but small at these sample sizes, and it does not explain a spread of nearly four points in sale to list ratio between the softest and strongest bands. For a property specific read, the band is a starting point and a proper comparable analysis is the actual work.
Method notes and the full index series are on the Warren Housing Index page.
These figures cover every residential property type in the MLS, including townhouses and condominiums, not detached houses alone. Attached product sells below detached in Warren, so a detached only median would run higher.
The Garden State MLS data behind this post was refreshed on August 21, adding closings that had not recorded when this was written. The figures above have been recomputed on the refreshed record. One claim changed. The middle bands were reported selling at 101 to 102 percent of ask. On the refreshed record they sell at asking price, a median of 100.0 percent. The barbell shape holds on the two measures that carry it, days on market and the share clearing ask, where the middle still beats both ends by a wide margin.
- Garden State MLS closed sales, Warren Township (Somerset County), 364 closings from August 17, 2024 through August 20, 2026, queried via BigQuery view v_gsmls_enriched
- Warren Housing Index methodology and full series. https://blog.johnmangini.com/warren-housing-index/
Thinking about selling a Warren home?
Get a property specific analysis built from the same Warren sales database behind this article.
Request a Warren home analysis or call 732.236.1087
Start with what seven years of Warren data says about selling.

John Mangini
Broker / Owner, NextHome Premier

Warren Township resident and full time broker, licensed in New Jersey since 2002. Warren, Local. is written from live Garden State MLS data, township records and primary sources. Every figure is traceable to a source listed above.