Warren by the Numbers
One page holding the current, sourced figures for Warren Township, Somerset County, New Jersey: the housing market, the tax rate, the schools, the budget, the development pipeline and the town itself. Housing figures come from Garden State MLS closed sales, 4,812 Warren sales, the earliest closing February 6, 1997 and the most recent September 4, 2026. Population figures come from the US Census Bureau. Tax, school and budget figures come from adopted documents, each linked to the reporting that covered it. Updated September 6, 2026, and refreshed as new data closes.
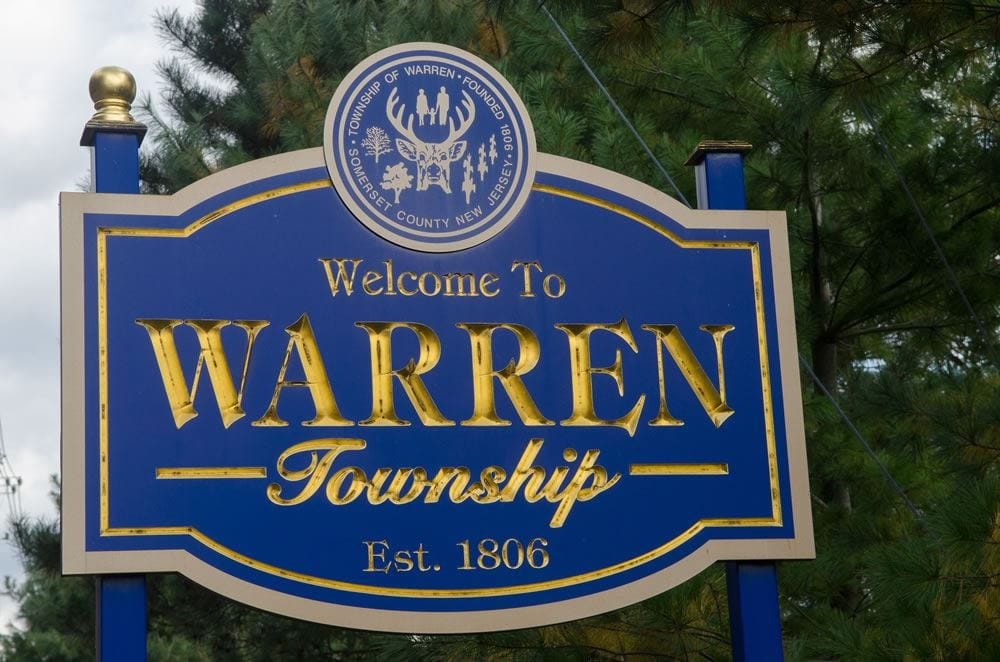
The town
The 2020 census counted 15,923 residents, a density of 813.8 people per square mile. The five year American Community Survey puts the township at 5,376 households averaging 3.0 people, a median age of 44.7, median household income of $204,063 in 2024 dollars, and median gross rent of $2,170. Warren is one of the three constituent member towns of Watchung Hills Regional High School, and it carries the 07059 ZIP code.
The housing market, trailing twelve months
180 homes closed in Warren over the past twelve months, $222.2 million in volume. A quarter sold under $835,000 and a quarter over $1,465,000, with the range running from $173,572 to $3,400,000. 36.7% closed above the final asking price and 45.0% closed at or above the original asking price. The typical sale was a 4 bedroom home built around 1994 on 1.5 acres, with 2,870 square feet of living area.
Living area is not reported on every sale, so square footage figures carry different sample sizes depending on how strictly they are drawn. The $419 per square foot above is the strictest basis: sale price divided by the county parcel record's living area, available on 140 of the 180 sales. The 2,870 square foot median is broader, taking the parcel record where it exists and the listing's own figure where it does not, which covers 167 of 180. The Warren Housing Index (WRNX) uses that same broader basis over the same twelve month window, drops observations outside $50 to $1,500 per square foot as data errors and leaves out the few sales with no property type on record, which is why it reports $414 on 163 sales rather than $419 on 140. Same market, three bases, each labelled wherever it appears.
The median asking price on what is currently listed is $1,660,000, and 213 new listings came to market over the past twelve months. Supply under six months is conventionally read as a seller's market. These counts are a snapshot and move weekly, and the coming soon count has been dropped because the feed no longer produces that status. The market page carries the current reading with monthly detail.
These figures cover every residential property type in the MLS, including townhouses and condominiums, not detached houses alone.
New listingsClosed sales
Every Warren listing and closing in the Garden State MLS, all residential property types, by month. August 2026 is the last complete month. Months of supply is deliberately not charted here. It needs the count of homes actively for sale on a past date, and this database holds each listing at its current status rather than a nightly snapshot, so a historical supply series cannot be reconstructed from it honestly. The current months-of-supply figure is on the market page and in the homepage dashboard.
The Warren Housing Index (WRNX)
The index tracks the median closed price per square foot of living area. Price per square foot is not immune to the mix of what happens to sell in a given year, but it removes the largest single distortion in a median price. Base year 2000 sat at $185 per square foot. The current reading, trailing 12 months to September 6, 2026, is $414 per square foot across 163 qualifying sales, up 2.9% against a year earlier.
The index peaked at 151.4 in 2007, fell to 117.9 by 2009, and did not exceed its 2007 peak again until 2021, when it reached 158.2. Every year from 2008 through 2020 sat below the 2007 mark. Warren per-square-foot pricing took fourteen years to make back the last cycle.
Method, full series and chart: the Warren Housing Index.
Two different medians, and why they differ
The Census Bureau puts the median value of an owner occupied Warren home at $930,800 for 2020-2024. The median Warren home that actually sold in the past twelve months closed at $1,182,500. Both are correct and they measure different things. The Census figure is what owners estimate their homes are worth, averaged across every owner occupied house in town including long held and older stock, over a five year window. The sale figure is what buyers paid this year for the specific homes that came to market. Use the Census figure for the housing stock as a whole and the sale figure for what a transaction looks like today.
What sells, by price band
Trailing twelve months, closed sales grouped by final sale price:
| Price band | Sales | Share | Median days | Median of ask | Sold over ask |
|---|---|---|---|---|---|
| Under $750,000 | 31 | 17.2% | 30 | 96.6% | 26% |
| $750,000 to $999,999 | 47 | 26.1% | 25 | 99.5% | 38% |
| $1,000,000 to $1,249,999 | 20 | 11.1% | 19 | 102.2% | 60% |
| $1,250,000 to $1,499,999 | 39 | 21.7% | 20 | 100.0% | 41% |
| $1,500,000 to $1,999,999 | 27 | 15.0% | 24 | 97.9% | 30% |
| $2,000,000 and up | 16 | 8.9% | 29 | 99.2% | 25% |
What does this mean for your house? Get a property specific analysis built from the same sales database behind this table. Request a Warren home analysis
What sells, by type and age
Of the 180 sales, 135 were single family houses at a median of $1,300,000 and 41 were condominiums or townhouses at a median of $835,000. The remaining 4 carry no property type in the record. The styles with five or more sales:
| Style | Sales | Median price |
|---|---|---|
| Colonial | 80 | $1,395,000 |
| Townhouse, interior unit | 26 | $837,500 |
| Ranch | 19 | $881,000 |
| Custom | 12 | $1,839,390 |
| Townhouse, end unit | 8 | $1,099,500 |
| Bi-level | 7 | $825,000 |
| Contemporary | 5 | $1,300,000 |
| Multi floor unit | 5 | $680,000 |
By the decade the home was built. Every sale is counted here, including the one with no year on record:
| Built | Sales | Median price | Median sq ft | Median per sq ft |
|---|---|---|---|---|
| Built 2000 or later | 65 | $999,000 | 2,836 | $414 |
| 1980s and 1990s | 52 | $1,427,000 | 3,474 | $404 |
| 1960s and 1970s | 39 | $999,000 | 2,377 | $433 |
| Before 1960 | 23 | $750,000 | 1,897 | $402 |
| Year built not reported | 1 | $679,000 | n/a | n/a |
The 1980s and 1990s stock carries the highest median price and a price per square foot near the bottom of the table, $404 against $402 for homes built before 1960. The reason is in the size column: at a median 3,474 square feet those are the largest houses Warren sells, and single family homes of that vintage sat on a median 1.5 acres against 1.4 acres for homes built since 2000. Buyers are not paying a premium for the 1990s, they are paying for square footage and land. The recent stock reads smaller mostly because much of it is attached: only 24 of the 65 sales built since 2000 were single family houses.
By lot size, single family houses only. Attached homes are excluded because their lot records are not comparable: the listing field for a townhouse often carries the whole association's acreage while the county parcel record for the same unit carries a small per-unit footprint, a median of 0.04 acres across five years. The two sources distort in opposite directions, so neither belongs in a lot size comparison against detached houses. Lot size is the county parcel acreage, so this table covers the 134 of 135 detached sales matched to the county file:
| Lot size | Sales | Median price |
|---|---|---|
| Under half an acre | 17 | $1,180,000 |
| Half an acre to one acre | 25 | $1,305,000 |
| One to two acres | 73 | $1,300,000 |
| Two acres or more | 19 | $1,459,000 |
Detached medianAttached median (townhouse and condominium)
Median closed price by calendar year, detached against attached. Sales under $200,000 are excluded as likely non arms length transfers, which is why 2014 shows no attached point: the only attached sales that year fell below the floor. Property type is only reliably coded from 2009 forward, so the series starts there. 2026 is a partial year and is drawn dashed.
Attached share of all Warren sales
The mix, not the price. Attached product was under four percent of Warren closings for most of the 2010s and reached 23.3 percent in 2025. A townwide median that mixes the two is measuring the mix as much as the market, which is why this publication reports detached separately.
The record, year by year
Closed Warren sales by calendar year. 2026 is excluded because the year is incomplete. The trailing twelve month figures at the top of this page are the current reading.
| Year | Sales | Median price | Index per sq ft | Median days | Median of ask |
|---|---|---|---|---|---|
| 2015 | 160 | $673,000 | $253 | 55 | 96.6% |
| 2016 | 186 | $767,500 | $248 | 62 | 96.2% |
| 2017 | 201 | $741,200 | $260 | 49 | 96.7% |
| 2018 | 187 | $750,000 | $255 | 47 | 96.4% |
| 2019 | 193 | $825,000 | $243 | 61 | 97.0% |
| 2020 | 208 | $750,500 | $243 | 39 | 97.1% |
| 2021 | 267 | $839,000 | $293 | 22 | 100.0% |
| 2022 | 230 | $945,000 | $312 | 22 | 100.0% |
| 2023 | 199 | $979,000 | $352 | 20 | 100.0% |
| 2024 | 183 | $1,079,648 | $390 | 23 | 100.0% |
| 2025 | 180 | $1,137,500 | $409 | 24 | 99.4% |
The median Warren sale was $545,000 in 2000 and $702,500 in 2010. Against the current $1,182,500, that is a rise of 117.0% since 2000, which sits close to the index's per-square-foot +123.4% over the same span. Two different methods, nearly the same answer.
Property taxes
Assessments run below market. On the 179 of the past year's sales with an assessment on file, the median assessment was 74.0% of the eventual sale price. Never estimate a bill by multiplying the rate by a market price. Use the actual assessment on the property record.
The certified rate applied to a 74.0% assessment ratio would imply an effective rate near 1.36%, above the 1.26% measured on actual bills. The three figures rest on different samples and different years and cannot be chained: the rate is the county's 2025 certification, the assessment ratio is a median across the 179 sales with an assessment on file, and the effective rate is a median across the 179 sales reporting a tax bill, where the bill on record often reflects an earlier tax year. Read the 1.26% as what recent buyers were actually billed and the $1.841 as the authority for what is owed now. Neither substitutes for the Township Tax Collector.
The components, the appeal deadline and the quarterly schedule are on the Warren property taxes page.
Schools
Warren children attend two legally separate districts: Warren Township Schools for kindergarten through eighth grade, then Watchung Hills Regional High School, whose member municipalities are Warren Township, Watchung Borough and Long Hill Township. Each has its own board, budget and line on the tax bill, and the high school costs the average assessed Warren home $3,546 a year. School list, addresses and calendars: the Warren schools page.
Township government and budget
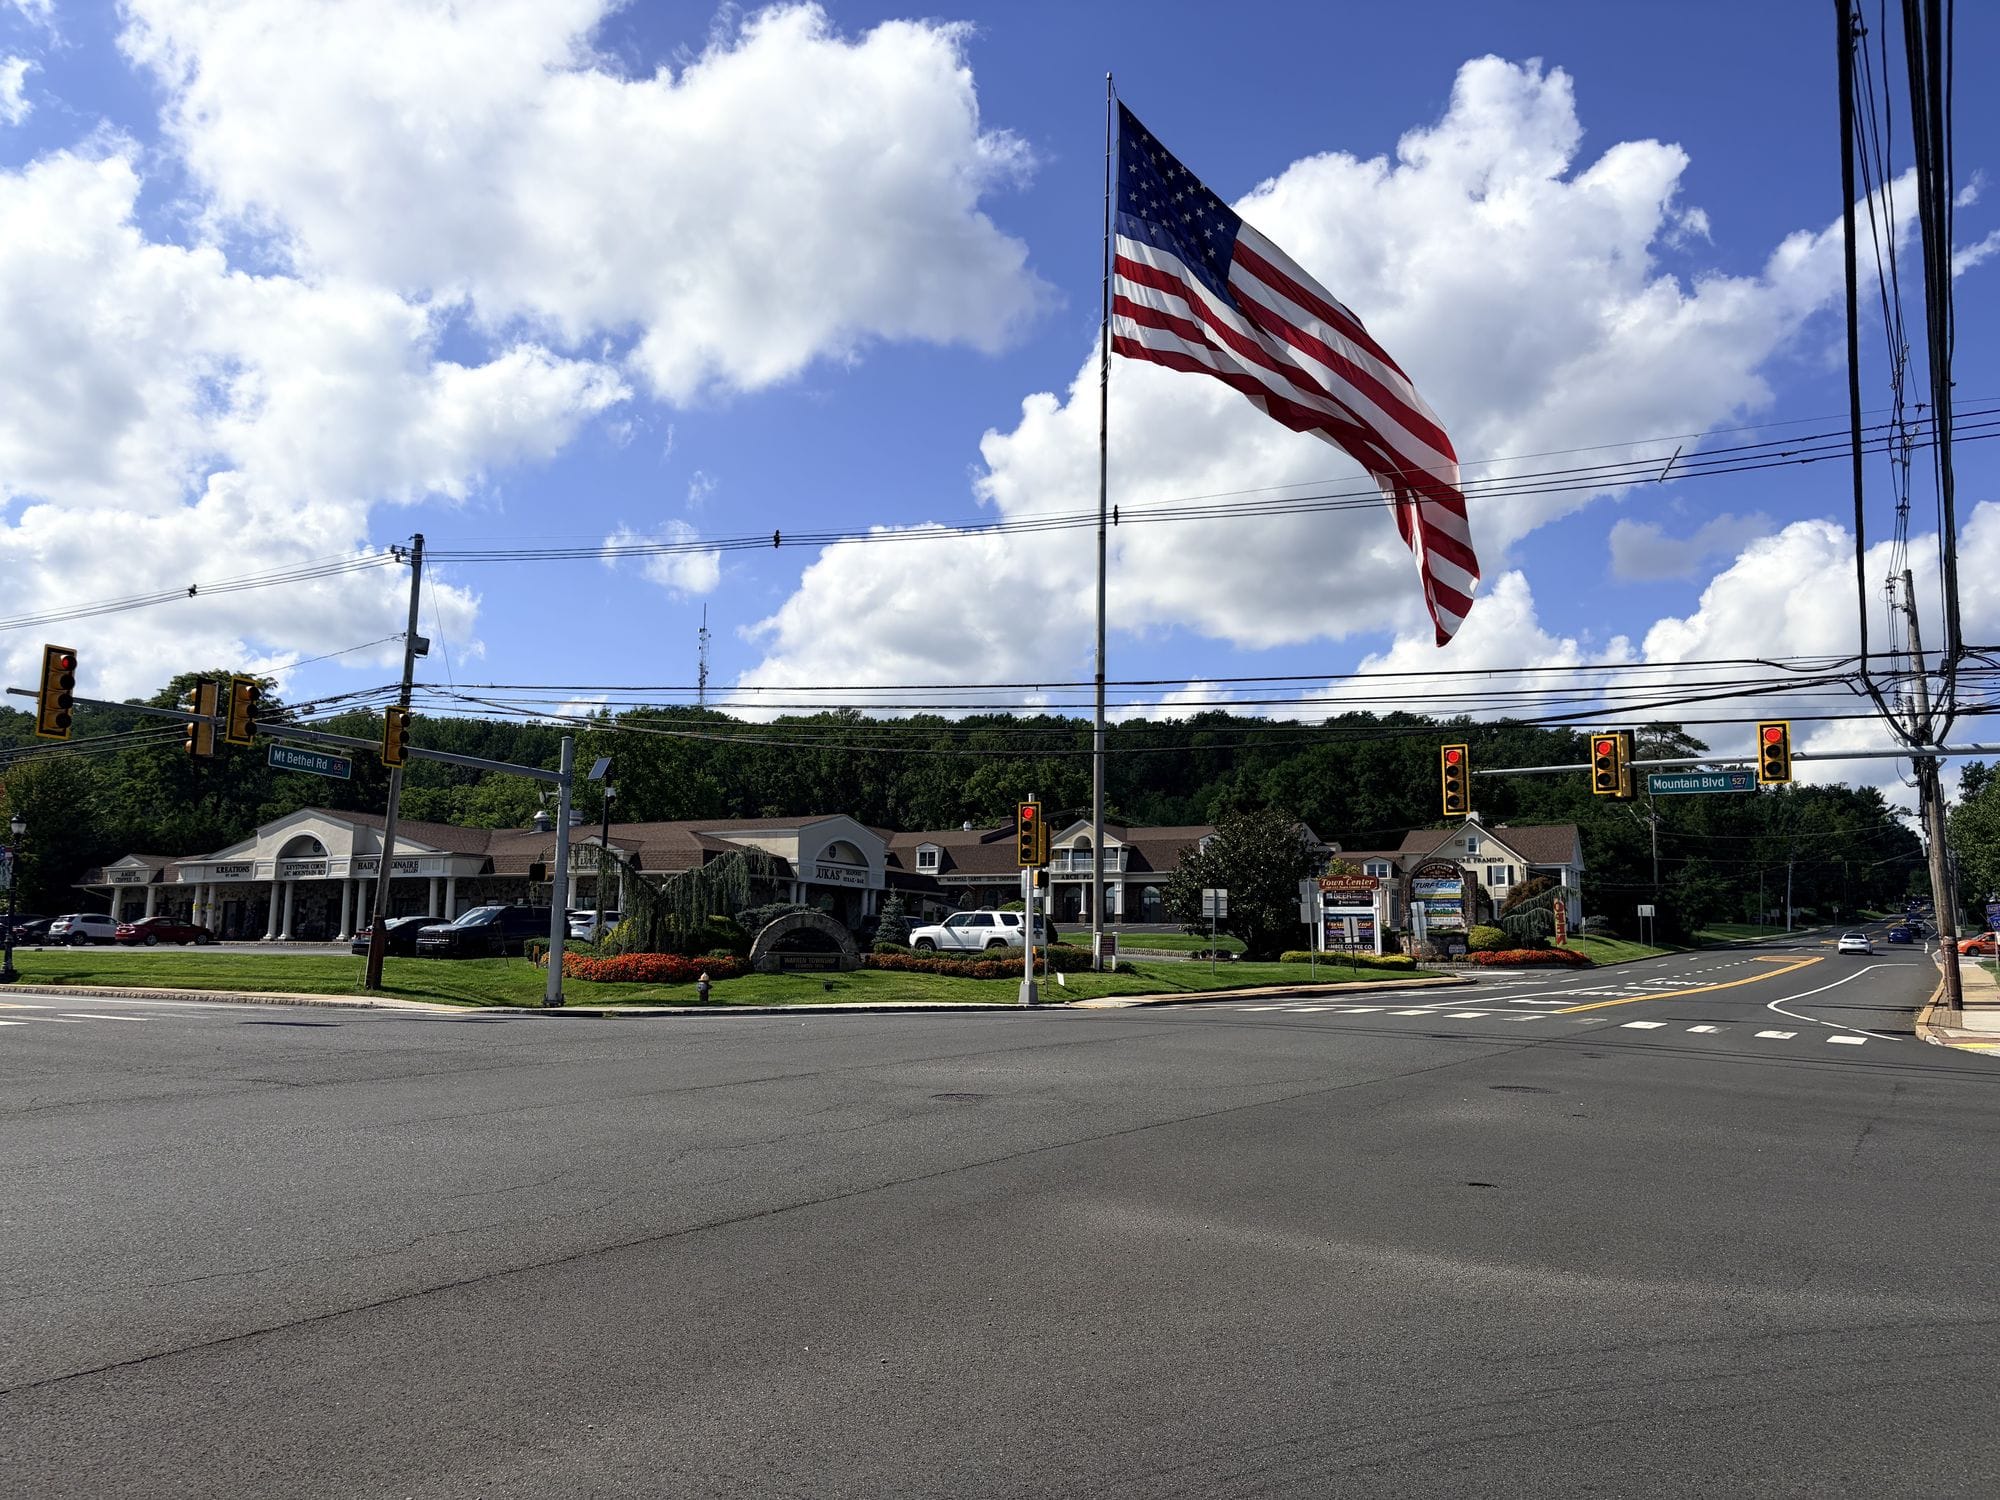
Warren is governed by a five member Township Committee that selects a mayor from its own membership each January. The 2026 budget was adopted 5-0 on May 14. On the same night the Committee placed a non binding public question on the November 3 ballot asking whether to restore the Hofheimer House. Coverage: the budget as introduced, the adoption and the ballot question.
Development
Warren's Fourth Round obligation of 262 units is satisfied on paper by 197 units plus 65 bonus credits, spread across six components, with four new districts created this year to zone for them. The financing deadline is March 15, 2027. Every project with an adopted ordinance, filed agreement or signed contract behind it is tracked in the development pipeline, and the district ordinances are covered in the affordable housing story. Warren has also prohibited data centers in every zoning district. Every zoning district, what each one actually delivers in lot size, and the 2026 ordinance record are on the Warren zoning and development page.
Utilities
Of the 990 single family sales that closed since 2021 and reported a utility, 11.0 percent listed a septic system and 21.6 percent listed a private well. Counting either, 248 of 993 sales, about one in four. On heat, 1,752 of the 1,887 sales since 2016 that reported a source listed natural gas, and 11 listed an underground oil tank. The full breakdown, including what each utility costs a seller and what the township requires at transfer, is on the well, septic, sewer and water page.
Where these figures come from
The computation standards behind every figure here, including the three price per square foot bases, the exact median rule and what this publication refuses to print, are on the data and methodology page.
- Garden State MLS closed sales for Warren Township: 4,812 sales, February 6, 1997 through September 4, 2026. Superseded records excluded. Analysis is original to this publication.
- US Census Bureau QuickFacts, Warren township, Somerset County, New Jersey. census.gov
- US Census Bureau, American Community Survey five year estimates, via Census Reporter.
- Somerset County Abstract of Ratables, 2025 certified general tax rate.
- Adopted 2026-27 budgets and User Friendly Budgets, Warren Township Schools and Watchung Hills Regional High School District.
- Township of Warren, adopted CY2026 municipal budget and 2026 ordinances and resolutions, as covered in the linked reporting.
Updated September 6, 2026. Housing figures refresh as sales close, government figures as documents are adopted. If a number here ever disagrees with a Township, county or district document, the document governs and this page is wrong.
Thinking about selling a Warren home?
Get a property specific analysis built from the same Warren sales database behind this article.
Request a Warren home analysis or call 732.236.1087
Start with what seven years of Warren data says about selling.


Warren Township resident and full time broker, licensed in New Jersey since 2002. Warren, Local. is written from live Garden State MLS data, township records and primary sources. Every figure is traceable to a source listed above.