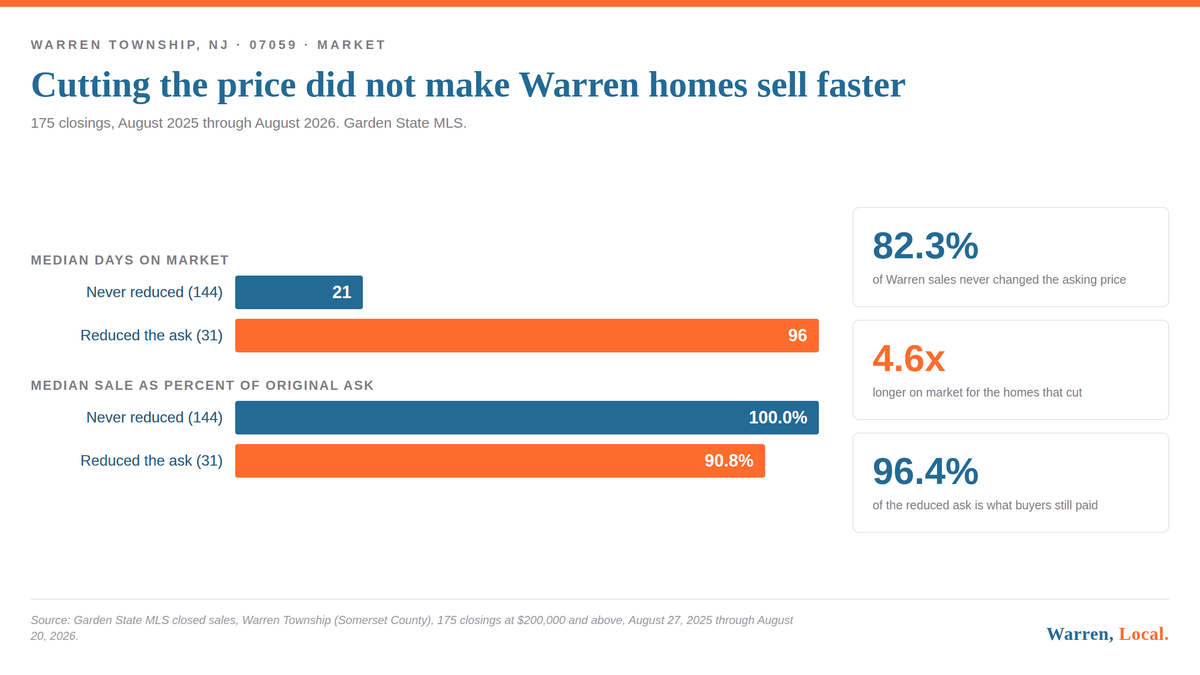
The 31 Warren sellers who cut their price took 96 days to sell. The 144 who did not took 21.
Of 175 Warren closings in twelve months, 31 cut the asking price. Those took 96 days and closed at 90.8 percent of the original ask. The other 144 took 21 days.

This story updates the market tape, the running file that carries the current status.
Warren Township recorded 175 closings at $200,000 and above in the twelve months through August 20, 2026. Of those, 144 never changed the asking price and sold in a median of 21 days at 100.0 percent of the original ask. The other 31 cut the price at least once. Those took a median of 96 days, closed at 90.8 percent of the original ask, and still gave up another 3.6 percent off the reduced number at the table. Cutting the price is not what makes a Warren house sell, and the record does not show it buying speed either.
Every seller who watches a listing sit reaches the same question, which is whether to cut. It is worth knowing what the last twelve months of Warren closings actually did, because the answer is less encouraging than the advice usually is.
I split every Warren closing from August 27, 2025 through August 20, 2026 into two groups. One group's final asking price matched the price it launched at. The other group's final asking price was lower than its original. Here is how the two groups finished.
| Group | Closings | Median days | Median sale | Percent of original ask | Share at or over original ask |
|---|---|---|---|---|---|
| Never reduced | 144 | 21 | $1,186,500 | 100.0% | 54.9% |
| Reduced at least once | 31 | 96 | $947,000 | 90.8% | 0.0% |
| All closings | 175 | 24 | $1,180,000 | n/a | 45.1% |
Not one of the 31 homes that cut its price recovered the original number. Three of them beat their own reduced ask. The rest closed under it.
Cutting deeper did not buy speed
The obvious follow up is whether the size of the cut matters. If a small cut is too timid to move a buyer, a bigger one should work better. In Warren, over these twelve months, it did not.
| Size of the cut | Closings | Median days | Sale as percent of original | Sale as percent of reduced ask |
|---|---|---|---|---|
| Under 5 percent | 15 | 92 | 94.3% | 97.7% |
| 5 to 9.9 percent | 9 | 90 | 87.7% | 95.0% |
| 10 percent or more | 7 | 112 | 81.1% | 96.4% |
The three groups land within 22 days of each other, and the deepest cutters took the longest. The dollar cuts themselves ran from $2,000 at the small end to $850,000 at the large end. Whatever the reduction accomplished, it was not a shorter wait.
Read the last column instead. In all three groups the buyer still negotiated off the reduced price, by 2.3 to 5.0 percent. A price cut in Warren has not functioned as a floor. It has functioned as a new starting point.
These homes did not sit because they cut. They cut because they were sitting. A listing that draws no offer in its first month is different from one that draws three in its first week, in condition, in location, in how far the launch price sat above the market, and the record here cannot separate those. What the table does establish is that the cut, once made, did not reset the clock. Treat it as a description of what happened to 31 houses, not as a prediction about yours.
Where the cuts happen
Sorted by the price the home launched at, the reductions are not spread evenly.
| Original asking price | Closings | Number that cut | Share that cut | Median days |
|---|---|---|---|---|
| Under $900,000 | 59 | 11 | 18.6% | 24 |
| $900,000 to $1,299,999 | 47 | 4 | 8.5% | 14 |
| $1,300,000 to $1,799,999 | 45 | 11 | 24.4% | 35 |
| $1,800,000 and up | 24 | 5 | 20.8% | 29 |
The band from $900,000 to $1,299,999 is the outlier in both directions. It cut least often, at 8.5 percent, and it sold fastest, at a median of 14 days. That is the same middle of the market that turned up as the competitive zone when I cut two years of Warren sales by price band earlier this month. Sellers there rarely need a second price. Above $1.3 million, roughly one seller in four does.
What is on the market right now
Warren has 29 active listings as of today, at a median asking price of $1,525,000 and a median 46 days on market. Six of the 29 have already reduced. Eleven have been listed 60 days or longer. Another 28 are under contract.
The share of Warren sellers who end up cutting has barely moved year over year. It was 30 of 179 closings, or 16.8 percent, in the twelve months before this one. It is 31 of 175, or 17.7 percent, now. Roughly one Warren seller in six revises the price, and that has been true for two years.
These figures cover every residential property type in the MLS, including townhouses and condominiums, not detached houses alone. Attached product sells below detached in Warren, so a detached only median would run higher. Sales under $200,000 are excluded as likely non arms length transfers, which is why counts here differ from pages that do not apply that floor. The MLS records an original list price and a final list price but not the dates or the number of intermediate changes, so a seller who cut once and a seller who cut four times are in the same row. Days on market is the MLS field and does not capture a listing that was withdrawn and relisted under a new number.
I cannot see why any individual seller reduced. Some cuts follow an inspection, a relocation date, or an appraisal, and none of those reach the MLS price history. I also cannot separate a genuine market correction from a launch price that was never supportable, because the record holds only the two numbers and not the reasoning between them.
My read, and it is an opinion
This section is my judgment rather than a finding from the data, and it should be read that way.
The number that stays with me is 54.9 percent. More than half of the Warren sellers who never touched their price sold at or above it. That group is not lucky. It is the group that set a number the market could already carry on day one, and in a town where the middle band clears in 14 days, the launch price does most of the work. By the time a reduction is on the table, the listing has usually already spent the attention that a new listing gets, and the record above suggests it does not get that attention back.
None of which means never reduce. It means the reduction is a repair, not a strategy, and repairs cost more than getting it right the first time. If you want the underlying method, it is on the selling page, and the timing question is in which months Warren homes sell fastest.
Want your own address run against this data before you set a price? Email me and I will send the comparable set.
- Garden State MLS closed sales, Warren Township (Somerset County), 175 closings at $200,000 and above with close dates from August 27, 2025 through August 20, 2026, and 179 closings in the matching prior twelve months, queried via BigQuery view v_gsmls_enriched. Method notes at https://blog.johnmangini.com/warren-data-and-methodology/
- Garden State MLS active and under contract listings, Warren Township, as of August 26, 2026, same view. August 20, 2026 is the most recent recorded closing in the data, not the date of the last refresh.
- Warren price band analysis. https://blog.johnmangini.com/warren-price-bands/
- Warren Housing Index methodology and full series. https://blog.johnmangini.com/warren-housing-index/
Thinking about selling a Warren home?
Get a property specific analysis built from the same Warren sales database behind this article.
Request a Warren home analysis or call 732.236.1087
Start with what seven years of Warren data says about selling.

John Mangini
Broker / Owner, NextHome Premier

Warren Township resident and full time broker, licensed in New Jersey since 2002. Warren, Local. is written from live Garden State MLS data, township records and primary sources. Every figure is traceable to a source listed above.