One in four Warren home sales was all cash over the last twelve months, down from one in three, and the pullback is almost entirely in detached houses
42 of 172 Warren sales in the twelve months to September 16 were all cash, 24.4 percent, down from 34.5. Detached fell to 20.6 percent, townhouses held at 38.9.

The figures below are the September 16, 2026 read and are left as first published. As the record stands on October 21, the same twelve months hold 174 closings at $200,000 or more, 43 of them cash, 24.7 percent, with 12 carrying no financing type, because closings and financing entries that had not reported by September 16 have since been entered. The data callout's last closing date, September 10, is the September read as well. The record now runs to October 20, 2026. This version adds the cash sales by address, with the listing photo and the public record, in the section headed The 43 cash sales. I have taken out the opinion section. Everything that remains is the record.
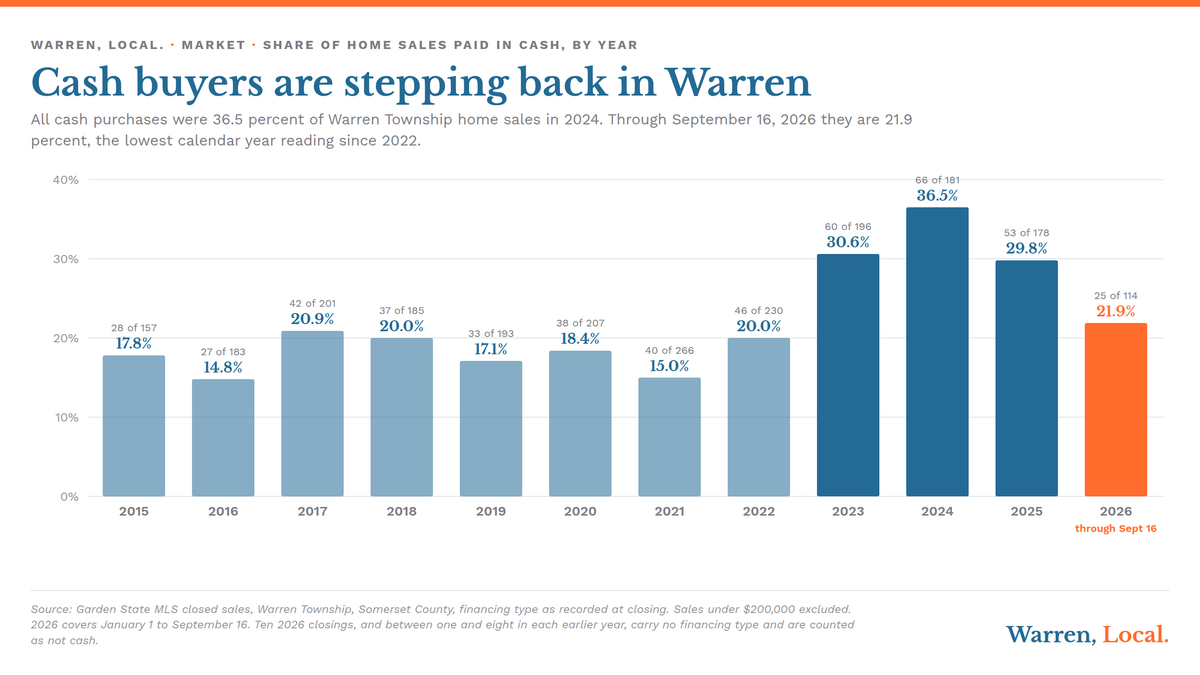
Forty two of the 172 homes that closed in Warren Township in the twelve months ending September 16, 2026 were bought without a mortgage, 24.4 percent of sales. In the twelve months before that, 61 of 177 sales were cash, 34.5 percent. The pullback is almost entirely in detached houses, where the cash share fell from 33.3 percent to 20.6 percent, while townhouses and condominiums held at 38.9 percent against 39.4 percent. On a calendar year basis the cash share peaked at 36.5 percent in 2024 and stands at 21.9 percent for 2026 through September 16, the lowest reading since 2022, with the caveat that ten 2026 closings carry no financing type in the record.
The twelve month picture
| 12 months to Sept 16, 2026 | Prior 12 months | |
|---|---|---|
| Closings at $200,000 and above | 172 | 177 |
| Bought with cash | 42 | 61 |
| Cash share of all sales | 24.4% | 34.5% |
| Bought with a mortgage | 118 | 110 |
| No financing type recorded | 12 | 6 |
| Cash share of sales with a recorded type | 26.3% | 35.7% |
The financing type is the one the listing office recorded when it reported the closing to the MLS. Cash means the buyer closed without a mortgage on the record. Mortgage covers conventional loans in nearly every case, plus a handful of FHA, VA, renovation and private loans. Twelve sales in the current window and six in the prior one carry no entry at all, and this post counts them as not cash. If every one of the twelve unrecorded sales this year had been cash, the share would be 31.4 percent, still below the 34.5 percent of the year before, so the direction holds under either treatment.
Detached houses lost their cash buyers, townhouses did not
| Segment | Sales, 12 months to Sept 16 | Cash | Cash share | Prior 12 months |
|---|---|---|---|---|
| Detached houses | 136 | 28 | 20.6% | 33.3%, 48 of 144 |
| Townhouses and condominiums | 36 | 14 | 38.9% | 39.4%, 13 of 33 |
| All residential types | 172 | 42 | 24.4% | 34.5%, 61 of 177 |
Nearly the whole decline sits in one segment. Cash bought 48 of the 144 detached houses that closed in the prior twelve months and 28 of the 136 that closed in the twelve months just ended. Townhouses and condominiums barely moved, 13 of 33 and then 14 of 36. In 2024, the peak year, cash bought half of the 20 attached homes that closed and 56 of the 161 detached houses. Attached homes are a growing share of what trades in Warren, as the detached and attached split showed two weeks ago, and they are now the segment where a cash offer is most common.
Where the cash went, by price
| Sale price | Sales, 12 months to Sept 16 | Cash | Cash share | Prior 12 months |
|---|---|---|---|---|
| Under $750,000 | 29 | 7 | 24.1% | 34.1%, 15 of 44 |
| $750,000 to $999,999 | 45 | 7 | 15.6% | 33.3%, 13 of 39 |
| $1,000,000 to $1,499,999 | 57 | 15 | 26.3% | 37.0%, 17 of 46 |
| $1,500,000 to $1,999,999 | 25 | 9 | 36.0% | 37.5%, 12 of 32 |
| $2,000,000 and up | 16 | 4 | 25.0% | 25.0%, 4 of 16 |
The retreat is concentrated below $1,500,000. Between $750,000 and $1,000,000 the cash share fell by more than half, from 33.3 percent to 15.6 percent, and the two bands on either side of it each gave up about ten points. Above $1,500,000 nothing changed: 36.0 percent against 37.5 percent in the $1,500,000 to $2,000,000 band, and four of sixteen sales in both windows at $2,000,000 and up. Somerset County's 2026 conforming loan limit is $1,209,750, and above a $1,512,188 purchase price a buyer putting 20 percent down needs a jumbo loan, the line the site drew in the conforming loan ceiling post. The bands where cash held are the bands where a mortgage means a jumbo for most buyers, and the bands where cash retreated are the ones a conforming loan can reach. Each band is a small sample, and one or two sales move any of these shares by several points.
How cash buyers behaved
| Measure | Cash, 42 sales | Mortgage, 118 sales | Cash, prior 12, 61 sales | Mortgage, prior 12, 110 sales |
|---|---|---|---|---|
| Median sale price | $1,290,000 | $1,172,500 | $1,120,000 | $1,100,000 |
| Median days on market | 32 | 22 | 20 | 24 |
| Median percent of last ask | 98.8 | 99.5 | 100.0 | 100.0 |
| Median percent of original ask | 97.8 | 98.7 | 100.0 | 99.2 |
| Closed at or over ask | 17 of 42 | 56 of 118 | 37 of 61 | 55 of 110 |
| Median days, under contract to closing | 42 | 45 | 43 | 45 |
| Townhouses and condominiums | 14 of 42 | 21 of 118 | 13 of 61 | 20 of 110 |
A year ago the cash buyer was the aggressive one. Thirty seven of 61 cash sales in the prior twelve months, 60.7 percent, closed at or over the asking price, against 50.0 percent of mortgage sales, and the median cash sale paid the full last ask. In the twelve months just ended, 17 of 42 cash sales met or beat ask, 40.5 percent, against 47.5 percent of mortgage sales, and the median cash buyer paid 98.8 percent of the last ask and 97.8 percent of the original one. The homes cash buyers bought had also sat longer, a median 32 days on market against 22 for mortgage buyers, where a year earlier it was 20 against 24. Fewer cash buyers, and the ones still buying negotiated.
The cash buyer's edge at the closing table is smaller than its reputation. The median cash sale went from under contract to closed in 42 days, the median mortgage sale in 45. The under contract date is the day the listing was marked under contract in the MLS, which in New Jersey usually follows attorney review, so this measures a firm contract to the closing table rather than offer to closing. A three day gap on the median is real, and it is not the month that cash is often assumed to save.
Cash buyers paid the higher median this year, $1,290,000 against $1,172,500, and the reverse of a year ago, when the two medians sat $20,000 apart. Read that with the price table above: the cash that stayed is in the $1,500,000 and up bands, and the cash that left was in the bands below.
The longer record
| Year | Sales at $200,000 and above | Cash | Cash share |
|---|---|---|---|
| 2015 | 157 | 28 | 17.8% |
| 2016 | 183 | 27 | 14.8% |
| 2017 | 201 | 42 | 20.9% |
| 2018 | 185 | 37 | 20.0% |
| 2019 | 193 | 33 | 17.1% |
| 2020 | 207 | 38 | 18.4% |
| 2021 | 266 | 40 | 15.0% |
| 2022 | 230 | 46 | 20.0% |
| 2023 | 196 | 60 | 30.6% |
| 2024 | 181 | 66 | 36.5% |
| 2025 | 178 | 53 | 29.8% |
| 2026, through September 16 | 114 | 25 | 21.9% |
From 2015 through 2022 the cash share of Warren sales stayed between 14.8 percent and 20.9 percent. It jumped to 30.6 percent in 2023, a year in which Freddie Mac's weekly 30 year fixed rate never fell below 6.09 percent and peaked at 7.79 percent, rose to 36.5 percent in 2024, and has come down in each year since. The 2026 figure is a partial year. Measured on the same January 1 to September 16 window, the share was 33.1 percent in 2024, 41 of 124 sales, 30.0 percent in 2025, 36 of 120, and 21.9 percent this year, 25 of 114. Ten of this year's 114 sales carry no financing type. Even if all ten were cash, 2026 would stand at 30.7 percent, level with 2025 rather than below it, which is why the calendar year comparison is printed with that caveat and the twelve month comparison above, where the same treatment moves the share to at most 31.4 percent, is the one to lean on.
Trailing twelve months, at each quarter end
| Twelve months ending | Sales | Cash | Cash share |
|---|---|---|---|
| December 31, 2022 | 230 | 46 | 20.0% |
| March 31, 2023 | 216 | 46 | 21.3% |
| June 30, 2023 | 211 | 52 | 24.6% |
| September 30, 2023 | 208 | 56 | 26.9% |
| December 31, 2023 | 196 | 60 | 30.6% |
| March 31, 2024 | 194 | 59 | 30.4% |
| June 30, 2024 | 187 | 56 | 29.9% |
| September 30, 2024 | 175 | 59 | 33.7% |
| December 31, 2024 | 181 | 66 | 36.5% |
| March 31, 2025 | 177 | 65 | 36.7% |
| June 30, 2025 | 176 | 63 | 35.8% |
| September 30, 2025 | 184 | 63 | 34.2% |
| December 31, 2025 | 178 | 53 | 29.8% |
| March 31, 2026 | 192 | 58 | 30.2% |
| June 30, 2026 | 184 | 49 | 26.6% |
| September 16, 2026 | 172 | 42 | 24.4% |
On a trailing twelve month basis, which smooths out the seasons, the cash share peaked at 36.7 percent in the year ending March 31, 2025, 65 of 177 sales, and has fallen in five of the six quarters since. It is now 12.3 points below the peak and back to about where it stood in the year ending June 30, 2023, when it was 24.6 percent.
Against the national figure
The National Association of Realtors reported that cash sales were 26 percent of existing home transactions in July 2026, up from 25 percent in June and down from 31 percent a year earlier. Warren's 24.4 percent of all sales, or 26.3 percent of sales with a recorded financing type, sits on top of the national number, and the direction matches: nationally the cash share is five points below a year ago, and in Warren it is ten points below. The two figures are not built the same way. NAR's comes from a monthly survey of its members, and Warren's comes from the financing field on closed MLS records, so treat the comparison as a check on direction rather than a matched measurement.
The 43 cash sales
These are the sales in the twelve months to September 16, 2026 whose closing was reported to the MLS with no mortgage, ranked by price, with the listing photo and the public record for the eight highest. Twenty eight were detached houses and fifteen townhouses or condominiums. Eight of the 43 were new construction by the year built on the listing, 2024 or later, seven of them at The Hills at Warren. Six were at Four Seasons at the Promenade. Four closed at $2,000,000 or more and fifteen under $1,000,000. The highest was 17 Countryside Lane at $2,900,000 and the lowest 24 Lara Place at $490,000. Seventeen of the 43 closed at or over the last asking price, the median closed at 98.5 percent of it, and the median time on market was 31 days. The longest on market was 24 Glenview Drive, 141 days.
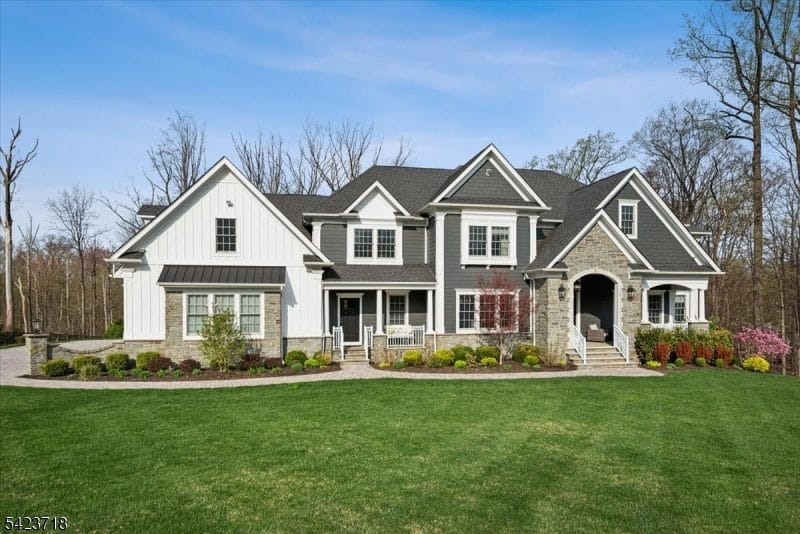
17 Countryside Lane
$2,900,000
Closed July 24, 2026 at 101.8 percent of a $2,850,000 ask, 12 days on market, no mortgage on the record.
5 bedrooms, 5 full baths, 1 half bath, 6,230 sq ft, built 2020, 3.00 acres
Image from Garden State MLS listing 4021326.
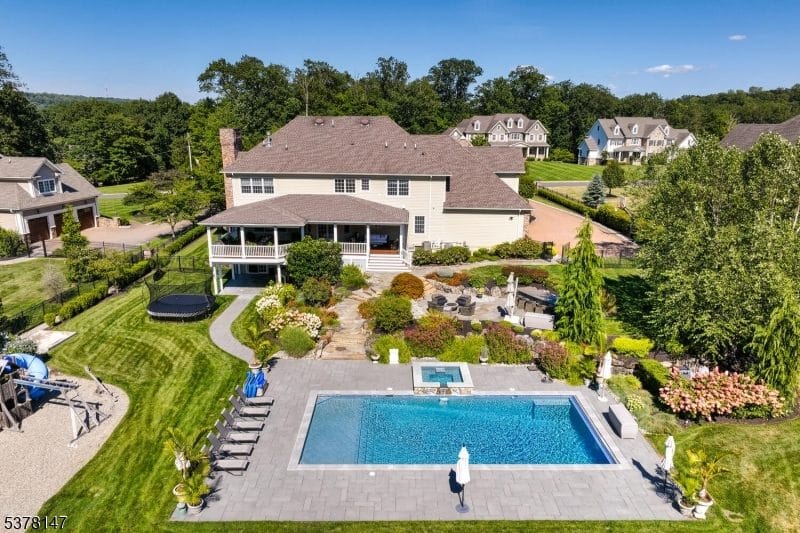
17 Conklin Lane
$2,425,000
Closed December 5, 2025 at 99.0 percent of a $2,450,000 ask, 47 days on market, no mortgage on the record.
6 bedrooms, 5 full baths, 1 half bath, 4,887 sq ft, built 2013, 1.74 acres
Image from Garden State MLS listing 3988038.
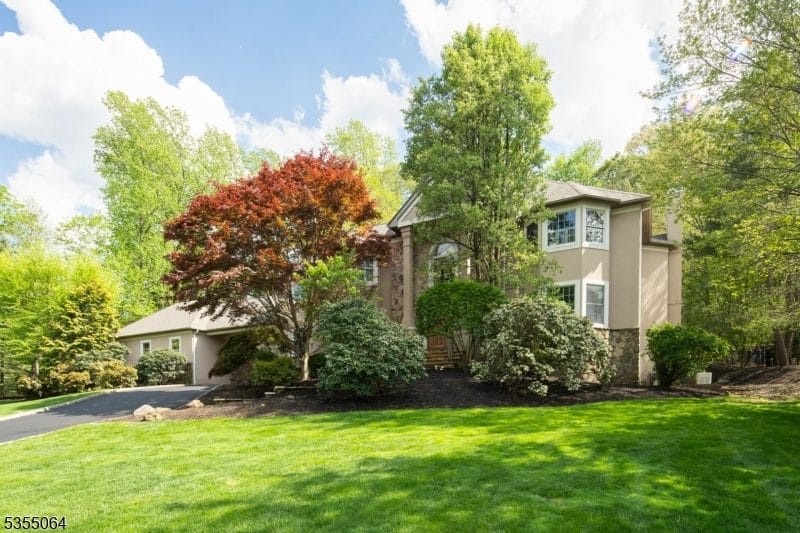
22 Nottingham Way
$2,200,000
Closed October 24, 2025 at 88.0 percent of a $2,500,000 ask, 103 days on market, no mortgage on the record.
5 bedrooms, 5 full baths, 2 half baths, 4,738 sq ft, built 1996, 1.18 acres
Image from Garden State MLS listing 3961913.
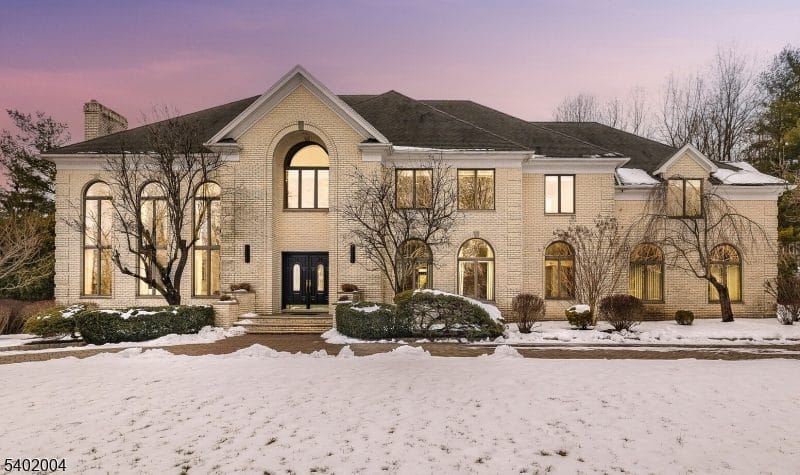
15 Quail Run
$2,175,000
Closed June 11, 2026 at 96.7 percent of a $2,250,000 ask, 24 days on market, no mortgage on the record.
6 bedrooms, 6 full baths, 1 half bath, 5,940 sq ft, built 1992, 1.14 acres
Image from Garden State MLS listing 4008889.
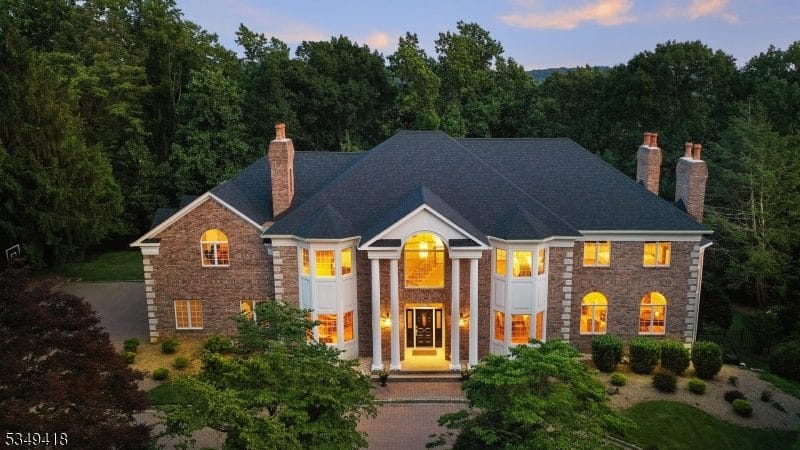
24 Glenview Drive
$1,995,000
Closed October 29, 2025 at 88.7 percent of a $2,250,000 ask, 141 days on market, no mortgage on the record.
5 bedrooms, 5 full baths, 1 half bath, 6,198 sq ft, built 1991, 1.50 acres
Image from Garden State MLS listing 3964562.
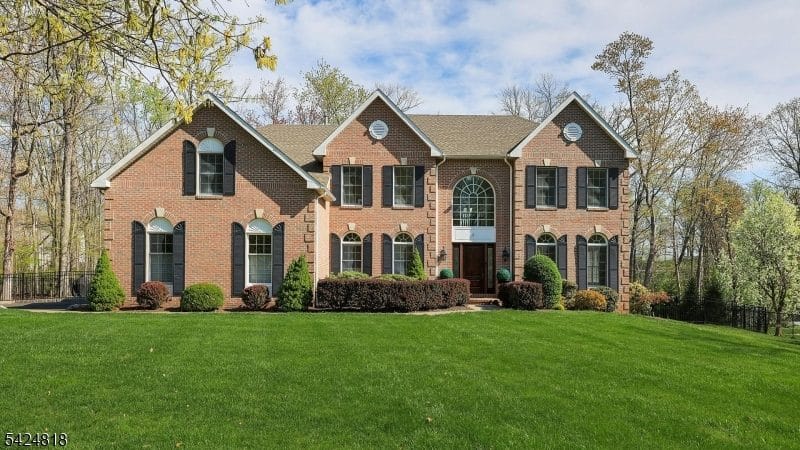
5 Longford Court
$1,900,000
Closed June 22, 2026 at 97.4 percent of a $1,950,000 ask, 11 days on market, no mortgage on the record.
5 bedrooms, 5 full baths, 1 half bath, 3,897 sq ft, built 1995, 0.94 acres
Image from Garden State MLS listing 4021566.
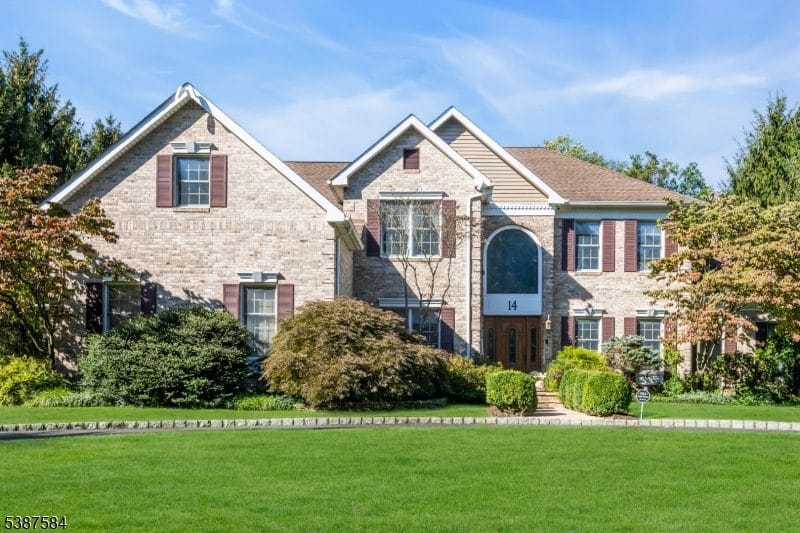
14 Downingtown Court
$1,820,000
Closed December 15, 2025 at 107.1 percent of a $1,700,000 ask, 24 days on market, no mortgage on the record.
5 bedrooms, 4 full baths, 1 half bath, 3,564 sq ft, built 1994, 0.94 acres
Image from Garden State MLS listing 3991090.
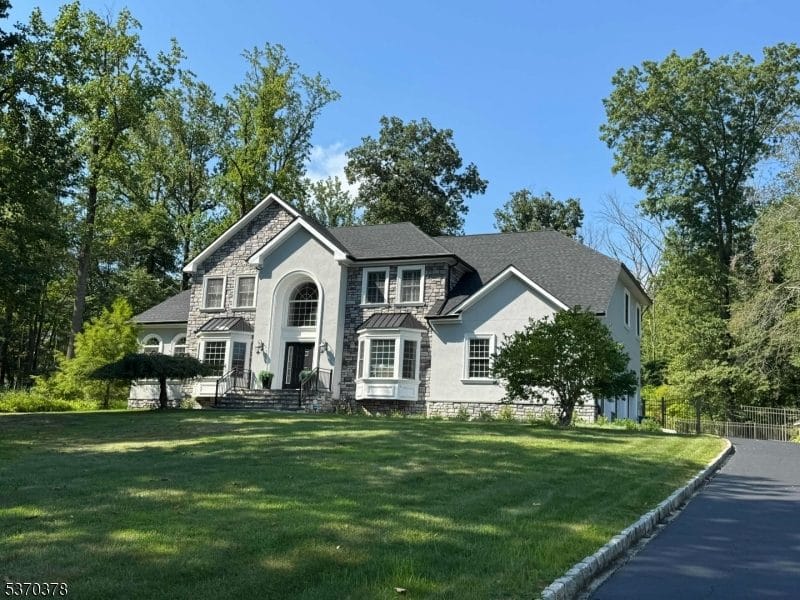
21 Darkwood Court
$1,775,000
Closed September 29, 2025 at 100.0 percent of a $1,775,000 ask, 0 days on market, no mortgage on the record.
5 bedrooms, 3 full baths, 1 half bath, 3,984 sq ft, built 2003, 1.75 acres
Image from Garden State MLS listing 3989597.
All 43 in one table. Cash means the financing type the listing office entered when it reported the closing was cash. The record does not say who the buyer was or whether a mortgage was placed on the home after closing.
| Home | Closed | Type | Last asking price | Sale price | Percent of ask | Days on market |
|---|---|---|---|---|---|---|
| 1. 17 Countryside Lane | Jul 24, 2026 | Detached | $2,850,000 | $2,900,000 | 101.8% | 12 |
| 2. 17 Conklin Lane | Dec 5, 2025 | Detached | $2,450,000 | $2,425,000 | 99.0% | 47 |
| 3. 22 Nottingham Way | Oct 24, 2025 | Detached | $2,500,000 | $2,200,000 | 88.0% | 103 |
| 4. 15 Quail Run | Jun 11, 2026 | Detached | $2,250,000 | $2,175,000 | 96.7% | 24 |
| 5. 24 Glenview Drive | Oct 29, 2025 | Detached | $2,250,000 | $1,995,000 | 88.7% | 141 |
| 6. 5 Longford Court | Jun 22, 2026 | Detached | $1,950,000 | $1,900,000 | 97.4% | 11 |
| 7. 14 Downingtown Court | Dec 15, 2025 | Detached | $1,700,000 | $1,820,000 | 107.1% | 24 |
| 8. 21 Darkwood Court | Sep 29, 2025 | Detached | $1,775,000 | $1,775,000 | 100.0% | 0 |
| 9. 14 Sugarwood Way | Sep 19, 2025 | Detached | $1,599,000 | $1,650,000 | 103.2% | 42 |
| 10. 26 Avon Road | Nov 21, 2025 | Detached | $1,689,000 | $1,650,000 | 97.7% | 134 |
| 11. 18 Avon Road | Jan 27, 2026 | Detached | $1,650,000 | $1,650,000 | 100.0% | 20 |
| 12. 57 Briarwood Drive | Jul 23, 2026 | Detached | $1,795,000 | $1,650,000 | 91.9% | 90 |
| 13. 22 Old Dutch Road | Feb 17, 2026 | Detached | $1,548,000 | $1,520,000 | 98.2% | 75 |
| 14. 122 Old Stirling Road | Mar 2, 2026 | Detached | $1,299,900 | $1,484,000 | 114.2% | 11 |
| 15. 30 Ellsworth Drive | Sep 2, 2026 | Detached | $1,450,000 | $1,450,000 | 100.0% | 15 |
| 16. 22 Crown Drive | Nov 25, 2025 | Detached | $1,500,000 | $1,447,000 | 96.5% | 35 |
| 17. 2 Monmouth Road | Jan 30, 2026 | Attached | $1,499,000 | $1,400,000 | 93.4% | 56 |
| 18. 11 Concord Court | Jun 1, 2026 | Attached | $1,399,000 | $1,350,000 | 96.5% | 60 |
| 19. 14 Lara Place | Oct 29, 2025 | Attached | $1,125,000 | $1,301,000 | 115.6% | 8 |
| 20. 7 Sycamore Way | May 27, 2026 | Detached | $1,395,000 | $1,300,000 | 93.2% | 63 |
| 21. 1 Fernwood Road | Jul 17, 2026 | Detached | $1,325,000 | $1,300,000 | 98.1% | 27 |
| 22. 17 Olsen Drive | Sep 30, 2025 | Detached | $1,299,000 | $1,280,000 | 98.5% | 97 |
| 23. 22 Park View Drive | Jan 20, 2026 | Attached | $1,269,000 | $1,265,000 | 99.7% | 12 |
| 24. 137 High Oaks Drive | Jul 27, 2026 | Detached | $1,349,000 | $1,236,000 | 91.6% | 112 |
| 25. 9 Corda Lane | Sep 30, 2025 | Attached | $1,175,000 | $1,200,000 | 102.1% | 32 |
| 26. 39 Red Hill Road | Nov 5, 2025 | Detached | $1,150,000 | $1,185,000 | 103.0% | 22 |
| 27. 7 Brady Road | Jan 30, 2026 | Detached | $800,000 | $1,100,000 | 137.5% | 19 |
| 28. 5 Jennifer Lane | Jan 28, 2026 | Detached | $995,000 | $1,050,000 | 105.5% | 13 |
| 29. 21 Lenape Trail | May 18, 2026 | Detached | $879,900 | $925,000 | 105.1% | 12 |
| 30. 125 Mountainview Road | Sep 16, 2026 | Detached | $944,888 | $900,000 | 95.2% | 9 |
| 31. 50 Round Top Road | Nov 21, 2025 | Detached | $875,000 | $881,000 | 100.7% | 9 |
| 32. 44 Dahlia Drive | Jul 30, 2026 | Attached | $879,000 | $873,000 | 99.3% | 77 |
| 33. 277 Jasmine Drive, Unit 1224 | Jan 30, 2026 | Attached | $904,336 | $840,000 | 92.9% | 31 |
| 34. 225 Myrtle Road | Aug 4, 2026 | Attached | $839,000 | $835,000 | 99.5% | 71 |
| 35. 221 Myrtle Road | Mar 11, 2026 | Attached | $849,900 | $830,000 | 97.7% | 125 |
| 36. 220 Myrtle Road, Unit 1424 | Oct 7, 2025 | Attached | $889,950 | $825,929 | 92.8% | 21 |
| 37. 55 Washington Valley Road | Jul 15, 2026 | Detached | $775,000 | $710,000 | 91.6% | 31 |
| 38. 120 Myrtle Road, Unit 1414 | Oct 17, 2025 | Attached | $750,504 | $690,000 | 91.9% | 68 |
| 39. 173 Jasmine Drive, Unit 1212 | Jan 27, 2026 | Attached | $675,000 | $655,000 | 97.0% | 96 |
| 40. 118 Myrtle Road, Unit 1413 | Oct 17, 2025 | Attached | $698,415 | $638,935 | 91.5% | 45 |
| 41. 22 Livingston Avenue | Mar 16, 2026 | Detached | $499,000 | $520,000 | 104.2% | 25 |
| 42. 17 Lara Place | Jul 31, 2026 | Attached | $495,000 | $500,000 | 101.0% | 34 |
| 43. 24 Lara Place | Oct 27, 2025 | Attached | $475,000 | $490,000 | 103.2% | 8 |
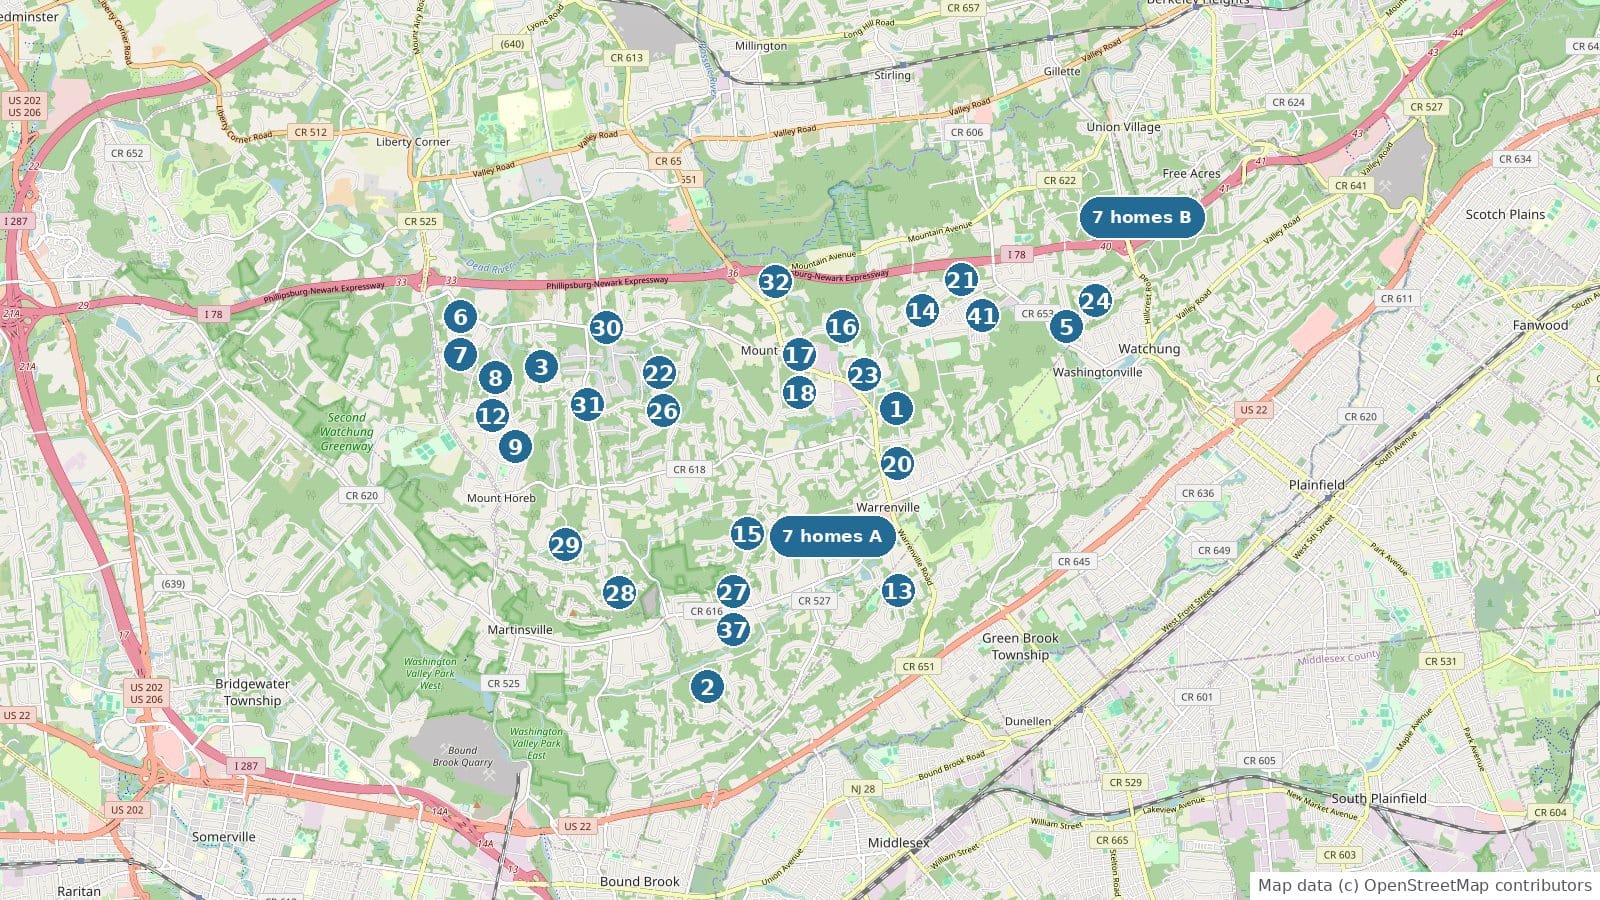
All figures come from Garden State MLS closed sale records for Warren Township, Somerset County, read September 16, 2026, filtered to exclude superseded listing records. The most recent closing in the record is September 10, 2026, which is the last recorded closing and not the date the record was refreshed. Warren Township is in Somerset County and is not Warren County. Sales under $200,000 are excluded throughout as likely non arms length transfers, the same floor the selling guide and the market tape apply, which is why this post counts 172 closings in the twelve months to September 16 where pages that apply no floor count 173. The financing type is the entry the listing office made when it reported the closing, and the record does not say whether a cash buyer later placed a mortgage on the property or how large a mortgage buyer's down payment was. Days on market count the current listing only. Percent of ask compares the sale price with the list price in effect at contract, and percent of original ask with the first asking price. Medians in an even count are the midpoint of the two middle sales, and median days are rounded to whole days. These figures cover every residential property type in the MLS, including townhouses and condominiums, not detached houses alone. Attached product sells below detached in Warren, so a detached only median would run higher.
Who the cash buyers are. The MLS record identifies the financing, not the buyer, so this post cannot say how many of the 42 cash purchases were owner occupants, builders or investors. Somerset County deed records carry the buyer's name and would settle that, and I did not pull them for this piece. Whether the twelve sales with no financing type were cash or financed. Their median price was $974,500, and one of the twelve was a townhouse or condominium. And whether the 2026 calendar year figure holds at 21.9 percent, since ten of this year's closings are among the unrecorded twelve. The twelve month comparison is the one built to survive that gap.
Figures are deemed reliable but are not warranted. Nothing here is a valuation of any particular property.
- Garden State MLS closed sale records for Warren Township, Somerset County, financing type as reported at closing, read September 16, 2026. https://www.gsmls.com
- National Association of Realtors, Existing-Home Sales report for July 2026, released August 11, 2026, cash sales 26 percent of transactions. https://www.nar.realtor/newsroom/nar-existing-home-sales-report-shows-1-7-decrease-in-july
- Freddie Mac, Primary Mortgage Market Survey, 2023 weekly results, 30 year fixed low of 6.09 percent on February 2, 2023 and high of 7.79 percent on October 26, 2023. https://www.freddiemac.com/pmms/archive?year=2023
- Warren, Local., the detached and attached split, September 2, 2026. https://blog.johnmangini.com/warren-detached-attached-split/
- Warren, Local., the conforming loan ceiling and Warren's jumbo share, August 21, 2026. https://blog.johnmangini.com/warren-conforming-loan-ceiling/
- Warren, Local., the market tape, where the $200,000 floor and the trailing twelve month method are set out. https://blog.johnmangini.com/warren-market-tape/
- Warren, Local., selling a home in Warren, by the numbers. https://blog.johnmangini.com/selling-a-home-in-warren/
- Garden State MLS closed sale records for Warren Township, Somerset County, one record per MLS number, read October 21, 2026, for the addresses, prices, dates and days on market in the homes behind the numbers. https://www.gsmls.com
- New Jersey MOD-IV property tax records for Warren Township, matched to each sale by block and lot, for living area, year built, lot size and assessment. https://www.nj.gov/treasury/taxation/lpt/localtax.shtml
- Garden State MLS IDX feed, the listing photo and coordinates for each sale. Photos are the listing photos from the MLS record.
Thinking about selling a Warren home?
Get a property specific analysis built from the same Warren sales database behind this article.
Request a Warren home analysis or call 732.236.1087
Start with what seven years of Warren data says about selling.

John Mangini
Broker / Owner, NextHome Premier

Warren Township resident and full time broker, licensed in New Jersey since 2002. Warren, Local. is written from live Garden State MLS data, township records and primary sources. Every figure is traceable to a source listed above.