Warren's price per square foot has nearly flattened, and the twelve month index is up just 1.5 percent
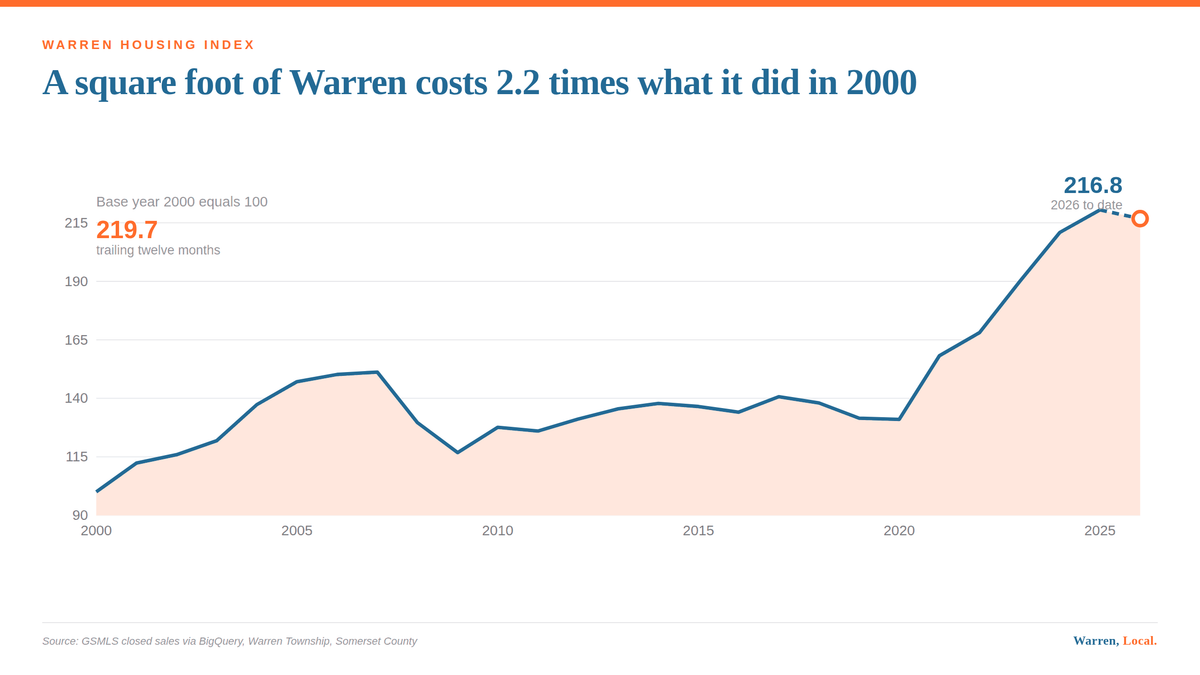
The Warren Housing Index reads 221.7 for the twelve months to August 20, up 1.5 percent. Price per square foot is down 0.9 percent year to date while median price is up 4.9 percent.

This story updates the market tape, the running file that carries the current status.
Home values in Warren Township, New Jersey have flattened on a per square foot basis. The Warren Housing Index (WRNX) reads 221.7 for the twelve months ending August 20, 2026, against 218.4 a year earlier, a gain of 1.5 percent. Median sale price rose 4.9 percent to $1,177,500 year to date, but median price per square foot fell 0.9 percent to $404. The gap is a mix effect, not appreciation. Closings fell from 185 to 176 over the same twelve months.
For five straight years, the answer to what a square foot of Warren Township costs has been "more than last year." That run has slowed to a crawl.
The Warren Housing Index, which tracks the median closed price per square foot of living area against a year 2000 base of 100, stands at 221.7 on a trailing twelve month basis through August 20. A year ago the same measure read 218.4. That is a gain of one and a half percent over twelve months.
For comparison, the twelve months ending August 2025 read 218.4 against 206.5 for the twelve months ending August 2024, a gain of 5.8 percent. The current year has delivered roughly a quarter of that.
Volume fell while price stood still
The index barely moved. The number of transactions behind it did not.
One hundred seventy six homes closed in Warren in the twelve months ending August 20, against 185 in the twelve months before. That is a decline of roughly 5 percent.
Year to date the pattern is the same but milder. One hundred two homes have closed between January 1 and August 16 this year, against 106 in the same window last year and 128 in 2023.
The apples to apples table
Comparing a partial year against a full year overstates or understates almost everything. The table below holds the window fixed at January 1 through August 16 for every year, so each row covers the same window, January 1 through August 16.
| Year | Closings | Median price | Median $/sf | Median DOM | Sale to list | Share over ask |
|---|---|---|---|---|---|---|
| 2020 | 106 | $714,750 | $236 | 42 | 96.9% | 12.3% |
| 2021 | 179 | $835,000 | $289 | 21 | 99.4% | 39.7% |
| 2022 | 136 | $967,500 | $310 | 18 | 100.0% | 47.1% |
| 2023 | 128 | $972,000 | $345 | 20 | 100.0% | 46.9% |
| 2024 | 103 | $1,127,000 | $387 | 24 | 100.0% | 46.6% |
| 2025 | 106 | $1,122,500 | $408 | 22 | 100.0% | 38.7% |
| 2026 | 102 | $1,177,500 | $404 | 24 | 100.0% | 40.2% |
Two lines in that table point in opposite directions, and the gap between them is the whole point.
Median sale price is up 4.9 percent year over year, from $1,122,500 to $1,177,500. Median price per square foot is down 0.9 percent, from $408 to $404.
Both numbers are correct. They disagree because the mix of what sold changed. When larger houses make up a bigger share of a thin year, the median price climbs even if no individual house appreciated. Price per square foot strips most of that out, which is why the index is built on it.
Competition did not soften
The easy reading of falling volume is that demand cooled. The execution numbers do not support that.
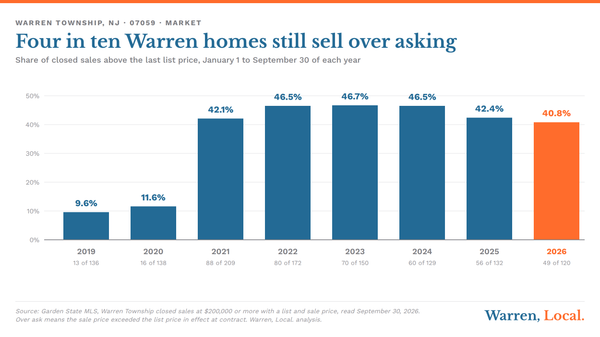
The median Warren sale closed at 100.0 percent of its last asking price this year, level with every year since 2022 in the window above. Sales at or above the final ask made up 40.2 percent of closings, up from 38.7 percent last year. Median days on market ran 24 against 22 a year earlier, essentially unchanged.
That is not the signature of buyers walking away. It is the signature of fewer houses reaching the market and the ones that do getting picked over quickly.
What is standing on the market right now
Twenty nine active listings against 176 closings over the trailing twelve months works out to two months of supply at the current pace. Of those 29 active listings, six have taken a price reduction from their original ask. The median active listing has been on the market 46 days, and none has been listed longer than six months.
Only three properties have come to market in the last fourteen days. August is seasonally the quietest listing stretch of the year in Warren, so that is not a surprise on its own, but it does mean the fall inventory picture will be set by what gets listed between now and the end of September.
A note on what these numbers can and cannot tell you
The index measures closings, which reflect contracts signed 30 to 90 days earlier. It is a record of the recent past, not a reading of today and not a projection of tomorrow.
Data coverage is also uneven. The living area figure behind the index comes from the county parcel record where a match exists and from the MLS approximate square footage where it does not. For 2026 closings, that combined coverage is 56 percent, well below the 92 percent typical of 2022 through 2024. The parcel join for the current year is thinner than usual because recent transactions have not yet been fully reconciled against tax records. The 2026 index point should be treated as provisional and will be revised as those records catch up.
Full methodology, the complete series back to 2000, and the construction rules are published on the Warren Housing Index page.
These figures cover every residential property type in the MLS, including townhouses and condominiums, not detached houses alone. Attached product sells below detached in Warren, so a detached only median would run higher.
The Garden State MLS data behind this post was refreshed on August 21, adding closings that had not yet recorded when this was written on August 16. Every figure above has been updated and the conclusions changed enough to state plainly what moved.
The index reading was 219.7, a gain of 0.6 percent over twelve months. It is 221.7, a gain of 1.5 percent. The trailing twelve month decline in closings was reported as 186 to 167, about 10 percent. It is 185 to 176, about 5 percent. Year to date closings were reported as 93 against 106 a year earlier. They are 102 against 106. Median price per square foot year to date was reported down 1.6 percent to $401. It is down 0.9 percent to $404.
Two claims did not survive. This post said the five year run of per square foot appreciation had stopped. At 1.5 percent it has slowed sharply but not stopped, and the headline has been changed to say so. It also said the year was running at the highest sale to list ratio in the seven year window. It is not. The median sale closes at asking price, level with every year since 2022.
The inventory section has also been rebuilt. It reported 45 active listings, 6 coming soon and roughly three and a half months of supply. The active count is 29, the feed no longer produces a coming soon status, and supply is 2.0 months. Most of that change is a correction to a stale active set rather than a market move. What does survive is the shape of the finding: price per square foot is close to flat year to date while the median sale price is up, and that gap is a mix effect rather than appreciation.
An earlier version of this post overstated the twelve month decline in closings as 30 percent, from 169 to 119, because of a data processing error that dropped part of the sold record. The figures at the time were 186 closings falling to 167, a decline of about 10 percent, since superseded by the August 21 refresh above. The index values were not affected. The text above has been corrected.
- Garden State MLS closed sales, Warren Township (Somerset County), queried via BigQuery view v_gsmls_enriched on August 16, 2026 and refreshed August 21, 2026
- Warren Housing Index methodology and full series. https://blog.johnmangini.com/warren-housing-index/
Thinking about selling a Warren home?
Get a property specific analysis built from the same Warren sales database behind this article.
Request a Warren home analysis or call 732.236.1087
Start with what seven years of Warren data says about selling.

John Mangini
Broker / Owner, NextHome Premier

Warren Township resident and full time broker, licensed in New Jersey since 2002. Warren, Local. is written from live Garden State MLS data, township records and primary sources. Every figure is traceable to a source listed above.