Thirteen Warren homes have sold for $2 million or more this year, the most for the period since 2000, while the tier below lost 11 sales
13 Warren sales at $2,000,000 or more through October 20, the most for the period since 2000. Sales from $1.5 to $2 million fell to 18 from 29.

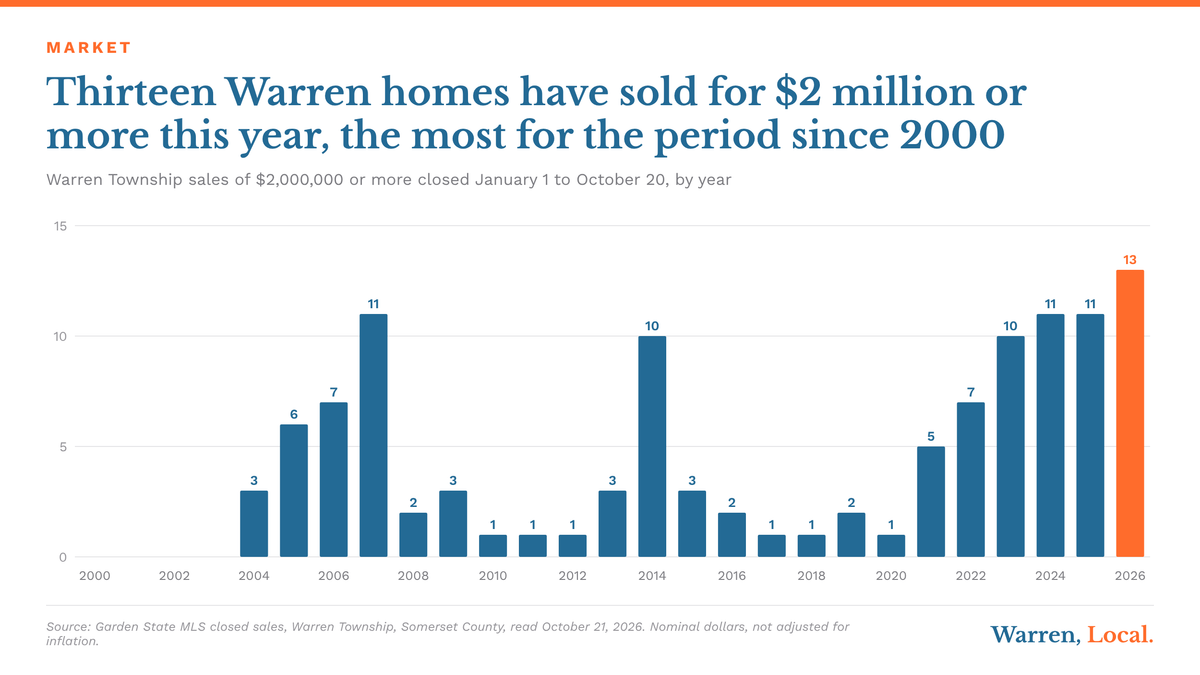
The figures below are as first published on October 21, 2026. This version adds the homes behind them: the thirteen sales at $2,000,000 or more, the eighteen in the tier below and the eleven of 2025, each by address, with the listing photo and the public record, in the sections headed The thirteen homes, The eighteen between $1,500,000 and $2,000,000 and The eleven of 2025. I have taken out the opinion section. Everything that remains is the record.
Thirteen Warren Township homes closed at $2,000,000 or more between January 1 and October 20, 2026, against 11 in the same window of 2025, 2024 and 2007. That is the most for the period in any year since the Garden State MLS record becomes complete in 2000, and 9.8 percent of all 132 sales. One tier lower, the picture reverses. Sales between $1,500,000 and $2,000,000 fell to 18 from 29, and that 11 sale drop accounts for the whole gap between this year's 132 closings and last year's 143. Today 9 of Warren's 31 active listings ask $2,000,000 or more, while 3 of its 26 homes under contract do.
Four price tiers, two years
I split every Warren sale of $200,000 or more that closed between January 1 and October 20 into four price tiers and compared this year with last. Three tiers ended within four sales of 2025. One did not.
| Sale price tier | 2026 sales | 2025 sales | 2026 median | 2025 median | 2026 median days | 2025 median days |
|---|---|---|---|---|---|---|
| Under $1,000,000 | 56 | 60 | $790,000 | $719,933 | 24.5 | 21 |
| $1,000,000 to $1,499,999 | 45 | 43 | $1,300,000 | $1,200,000 | 19 | 25 |
| $1,500,000 to $1,999,999 | 18 | 29 | $1,691,890 | $1,650,000 | 20 | 20 |
| $2,000,000 and up | 13 | 11 | $2,450,000 | $2,356,250 | 27 | 55 |
Add the changes and they cancel everywhere except the $1,500,000 to $2,000,000 tier. The bottom tier lost 4 sales, the two tiers on either side of it gained 2 each, and the 11 sales missing from the year all sit in that one band. For the overall medians, see the September recap and the market page, which carry them without the $200,000 floor used here.
How each tier sold
Speed alone does not separate the tiers. Price does. The $1,500,000 to $2,000,000 band is the only one where buyers paid less of the asking price this year than last.
| Sale price tier | 2026 median, percent of ask | 2025 median, percent of ask | 2026 closed over ask | 2025 closed over ask |
|---|---|---|---|---|
| Under $1,000,000 | 99.4% | 99.1% | 21 of 56 | 23 of 60 |
| $1,000,000 to $1,499,999 | 100.0% | 100.0% | 20 of 45 | 15 of 43 |
| $1,500,000 to $1,999,999 | 98.1% | 100.1% | 6 of 18 | 15 of 29 |
| $2,000,000 and up | 100.0% | 98.1% | 4 of 13 | 4 of 11 |
Percent of ask compares the sale price with the last list price on the record. Six of 18 sales over ask in the $1,500,000 to $2,000,000 tier is a third, against half a year ago. Above $2,000,000 the median sale matched its asking price and the median time on market halved, from 55 days to 27. Thirteen and eleven sales are small sets. One closing moves a median in either tier by weeks or by tens of thousands of dollars, so read the direction, not the decimals.
Where 13 sits in the record
| Year, Jan 1 to Oct 20 | All sales | $1,500,000 to $1,999,999 | $2,000,000 and up | Share at $2,000,000 and up |
|---|---|---|---|---|
| 2007 | 135 | 17 | 11 | 8.1% |
| 2014 | 135 | 5 | 10 | 7.4% |
| 2019 | 149 | 6 | 2 | 1.3% |
| 2020 | 157 | 9 | 1 | 0.6% |
| 2021 | 220 | 14 | 5 | 2.3% |
| 2022 | 187 | 14 | 7 | 3.7% |
| 2023 | 159 | 23 | 10 | 6.3% |
| 2024 | 137 | 25 | 11 | 8.0% |
| 2025 | 143 | 29 | 11 | 7.7% |
| 2026 | 132 | 18 | 13 | 9.8% |
Before 2026, the high for this window was 11, reached in 2007, 2024 and 2025. No Warren sale reached $2,000,000 in the window from 2000 through 2003. The share of sales at that level, 9.8 percent, is also the highest of the 27 years.
These are nominal dollars. A $2,000,000 sale in 2007 bought more house than one today, so the count overstates how much the top of the market has grown in real terms. More Warren sales are clearing the $2,000,000 line than at any point in the record, and they make up a larger slice of the year than before. Every sale above $1,500,000 is also a jumbo loan if it is financed, which I covered in the post on the conforming loan ceiling.
The market as of October 20
The listing side explains part of the gap. Fewer sellers came to market in the $1,500,000 to $2,000,000 band this year, and more came in above it.
| Price tier | Active now | Under contract now | Sales, last 12 months | Months of supply | New listings 2026, Jan 1 to Oct 20 | New listings 2025, same window |
|---|---|---|---|---|---|---|
| Under $1,000,000 | 9 | 9 | 72 | 1.5 | 64 | 82 |
| $1,000,000 to $1,499,999 | 8 | 10 | 58 | 1.7 | 58 | 53 |
| $1,500,000 to $1,999,999 | 5 | 4 | 22 | 2.7 | 28 | 38 |
| $2,000,000 and up | 9 | 3 | 15 | 7.2 | 30 | 19 |
| All tiers | 31 | 26 | 167 | 2.2 | 180 | 192 |
Active and under contract homes are placed by their current asking price. Sales are placed by sale price, and new listings by the price they first came on at. Months of supply divides the active count by the average monthly sales of the twelve months through October 20.
New listings in the $1,500,000 to $2,000,000 band fell from 38 to 28, about the same drop as its sales. Above $2,000,000 they rose from 19 to 30. Nine of those homes are for sale today and three are under contract, which puts more than seven months of supply in the top tier against less than two months below $1,500,000.
The thirteen homes
These are the thirteen sales, ranked by price, with the listing photo and the public record for each. Six of the thirteen were new houses built in 2024 or later, by the year built on the listing. Four closed over the last asking price, three closed at it and six closed under it. The highest was 8 Cobblestone Court at $3,400,000 and the lowest 19 Glenview Drive at exactly $2,000,000. The largest premium was 5 Cotswold Lane, which closed at 102.3 percent of its ask, and the largest discount was 9 Midvale Drive, at 92.5 percent. The longest on market was 10 Twin Brooks Court, 209 days, and the shortest 6 Stonehedge Court, 9 days. Two of the thirteen closed without a mortgage on the record, and three carry no financing type.
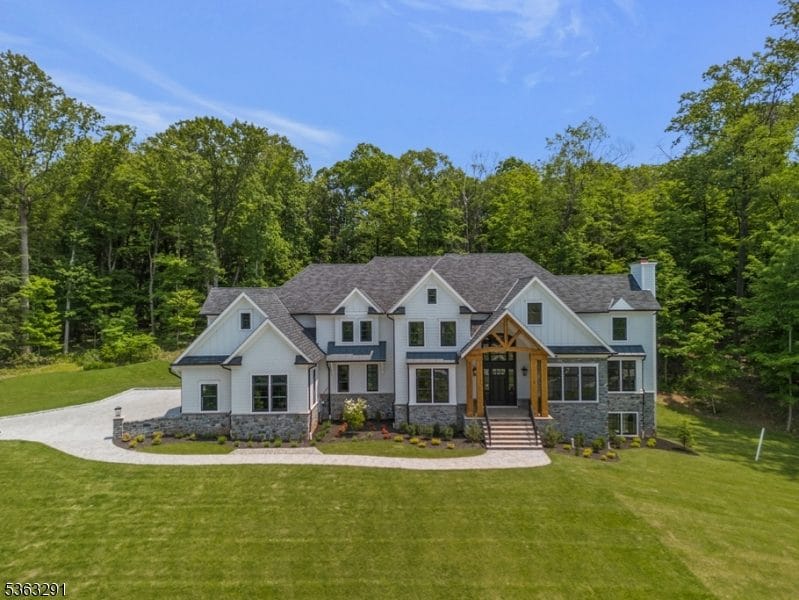
8 Cobblestone Court
$3,400,000
Closed June 22, 2026 at 100.0 percent of a $3,399,000 ask, 67 days on market.
5 bedrooms, 5 full baths, 1 half bath, 6,937 sq ft, new construction, built 2025, 3.16 acres
Image from Garden State MLS listing 4013365.
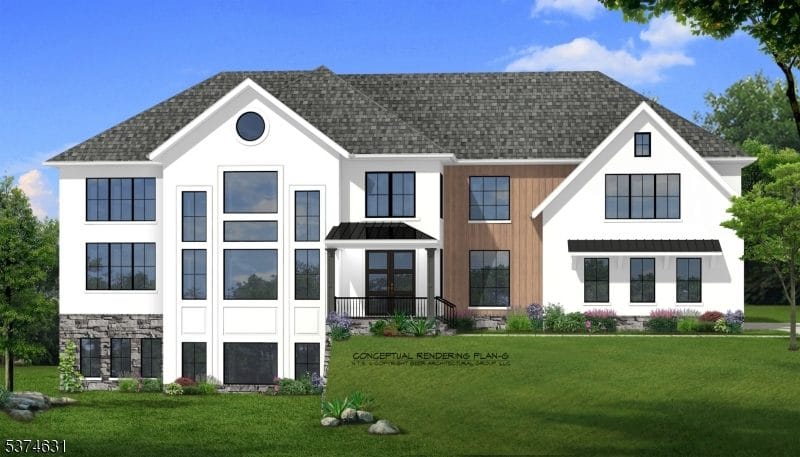
17 Old Church Road
$2,975,000
Closed July 24, 2026 at 100.0 percent of a $2,975,000 ask, 198 days on market.
5 bedrooms, 5 full baths, 1 half bath, 5,069 sq ft, new construction, built 2026, 1.65 acres
Image from Garden State MLS listing 3977926.
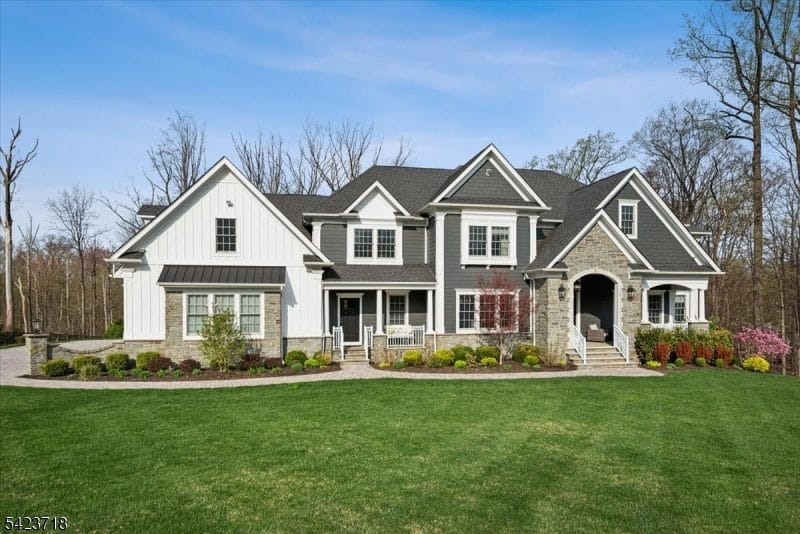
17 Countryside Lane
$2,900,000
Closed July 24, 2026 at 101.8 percent of a $2,850,000 ask, 12 days on market.
5 bedrooms, 5 full baths, 1 half bath, 6,230 sq ft, built 2020, 3.00 acres
Image from Garden State MLS listing 4021326.
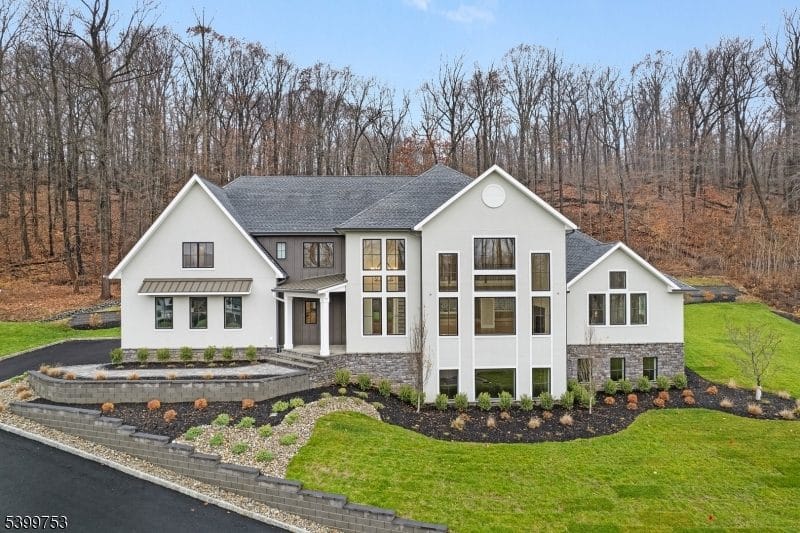
10 Twin Brooks Court
$2,750,000
Closed August 4, 2026 at 97.5 percent of a $2,820,000 ask, 209 days on market.
5 bedrooms, 5 full baths, 1 half bath, 4,900 sq ft, new construction, built 2025, 4.11 acres
Image from Garden State MLS listing 4000016.
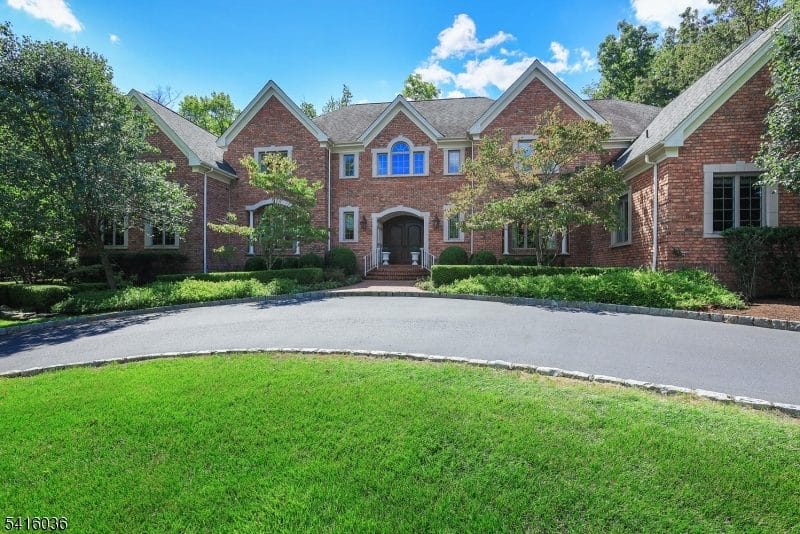
6 Thistle Lane
$2,595,000
Closed May 15, 2026 at 100.0 percent of a $2,595,000 ask, 19 days on market.
6 bedrooms, 5 full baths, 3 half baths, 5,576 sq ft, built 1999, 1.54 acres
Image from Garden State MLS listing 4015417.
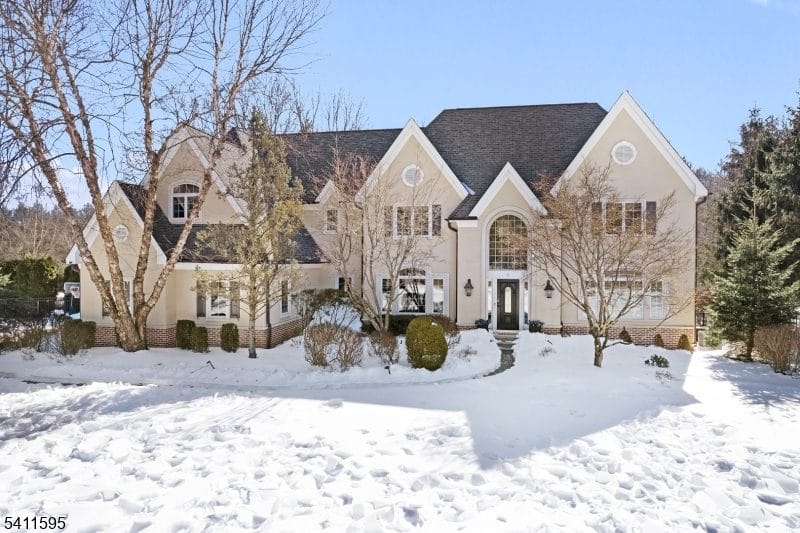
6 Stonehedge Court
$2,485,000
Closed April 27, 2026 at 99.4 percent of a $2,499,000 ask, 9 days on market.
4 bedrooms, 4 full baths, 1 half bath, 3,883 sq ft, built 1996, 1.50 acres
Image from Garden State MLS listing 4015209.
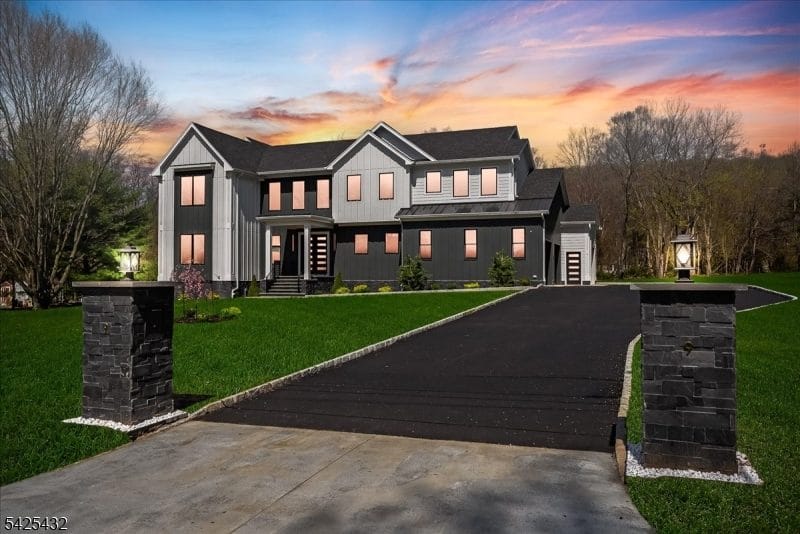
9 Midvale Drive
$2,450,000
Closed June 30, 2026 at 92.5 percent of a $2,650,000 ask, 27 days on market.
6 bedrooms, 6 full baths, 1 half bath, 6,630 sq ft, new construction, built 2026, 1.50 acres
Image from Garden State MLS listing 4022051.
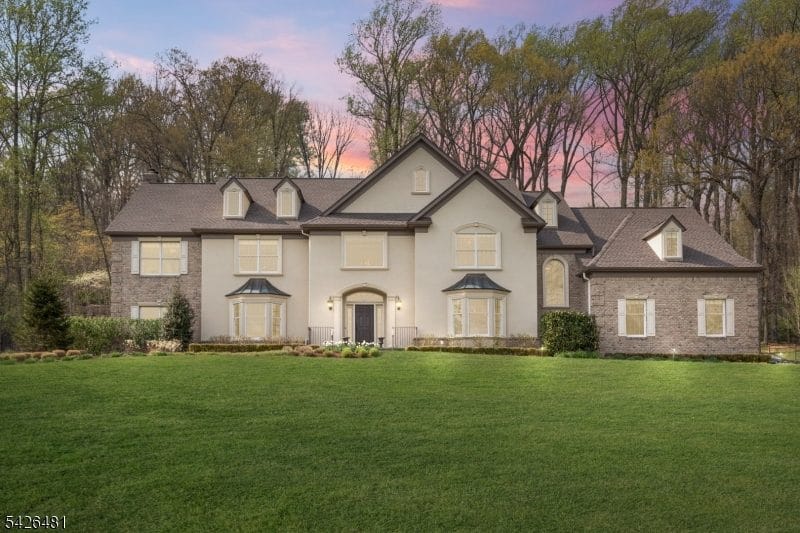
5 Cotswold Lane
$2,405,000
Closed June 17, 2026 at 102.3 percent of a $2,350,000 ask, 13 days on market.
6 bedrooms, 4 full baths, 1 half bath, 5,268 sq ft, built 1996, 2.38 acres
Image from Garden State MLS listing 4022652.
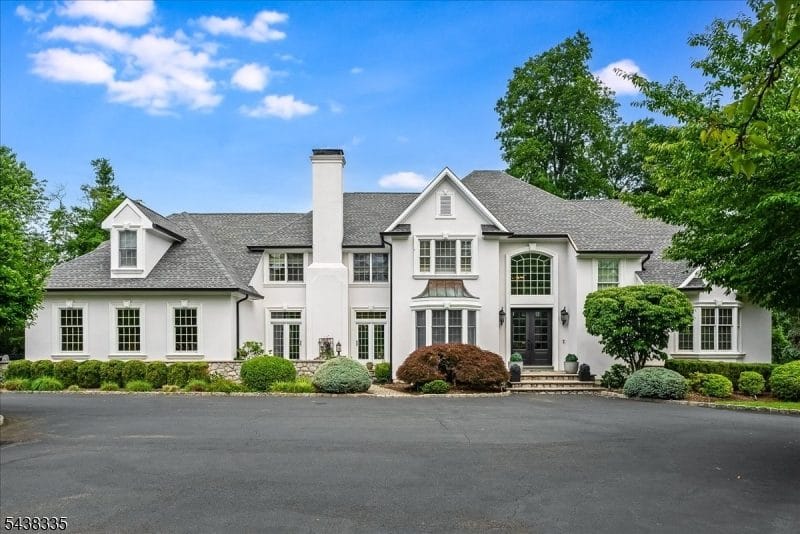
21 Rockage Road
$2,395,000
Closed August 12, 2026 at 101.9 percent of a $2,350,000 ask, 23 days on market.
5 bedrooms, 6 full baths, 2 half baths, 4,876 sq ft, built 1992, 1.60 acres
Image from Garden State MLS listing 4034770.
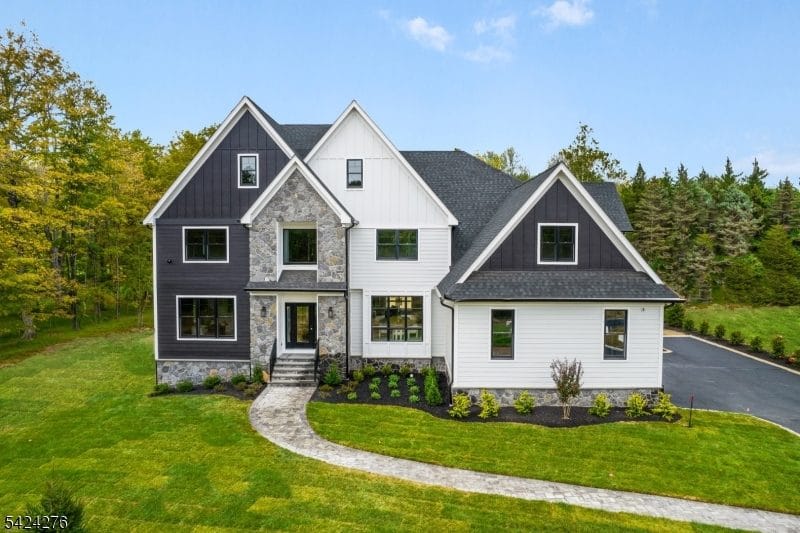
3 Brookside Drive
$2,374,000
Closed July 13, 2026 at 96.9 percent of a $2,449,000 ask, 30 days on market.
6 bedrooms, 5 full baths, 1 half bath, 5,512 sq ft, new construction, built 2025, 2.42 acres
Image from Garden State MLS listing 4020593.
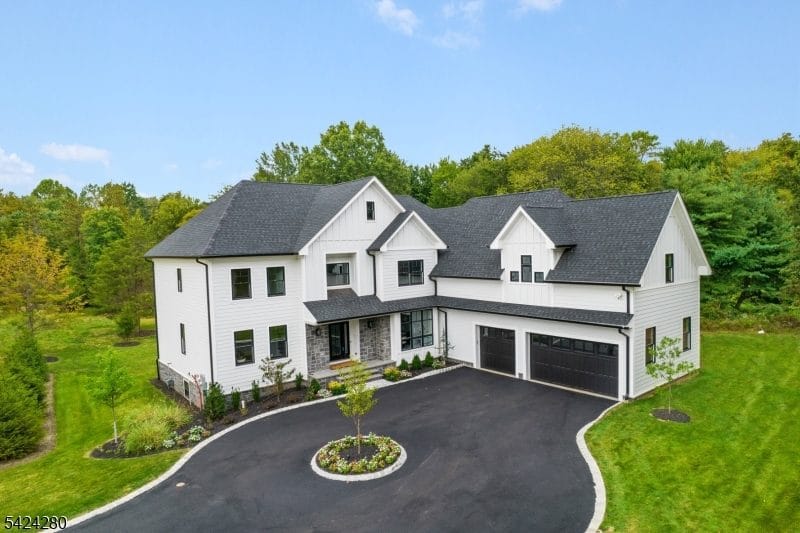
9 Brookside Drive
$2,350,000
Closed August 31, 2026 at 98.0 percent of a $2,399,000 ask, 94 days on market.
7 bedrooms, 6 full baths, 1 half bath, 5,182 sq ft, new construction, built 2024, 3.05 acres
Image from Garden State MLS listing 4020603.
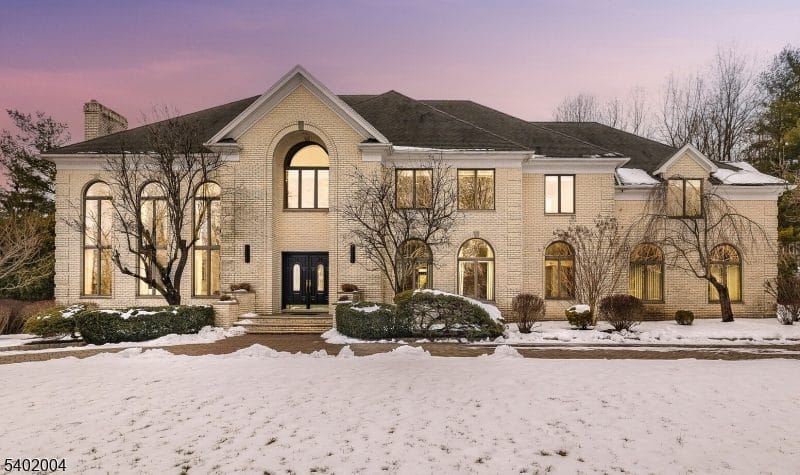
15 Quail Run
$2,175,000
Closed June 11, 2026 at 96.7 percent of a $2,250,000 ask, 24 days on market.
6 bedrooms, 6 full baths, 1 half bath, 5,940 sq ft, built 1992, 1.14 acres
Image from Garden State MLS listing 4008889.
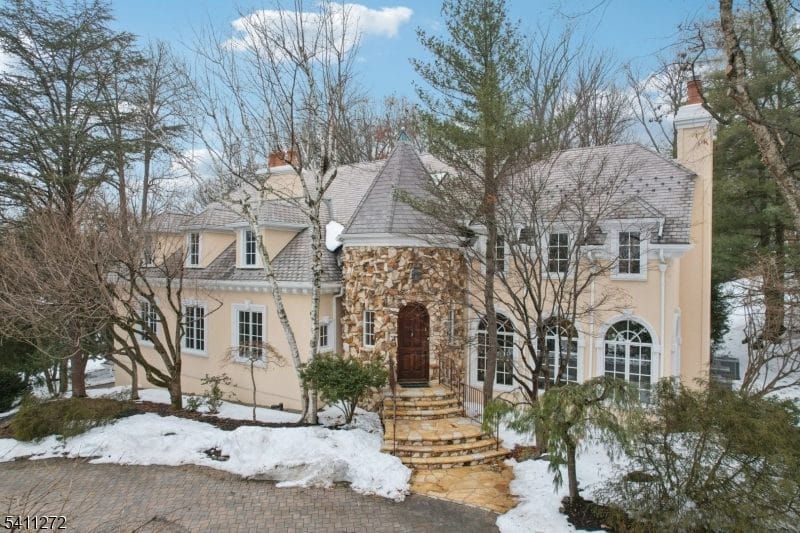
19 Glenview Drive
$2,000,000
Closed April 17, 2026 at 100.0 percent of a $2,000,000 ask, 27 days on market.
6 bedrooms, 6 full baths, 3 half baths, 6,731 sq ft, built 1994, 1.12 acres
Image from Garden State MLS listing 4009674.
The same thirteen in one table. Percent of ask compares the sale price with the last asking price on the record. Living area is the county parcel figure where the record has one, and the listing's own figure for new construction and where the parcel has none. Price per square foot divides the sale price by that living area.
| Home | Closed | Last asking price | Sale price | Percent of ask | Days on market | Living area, sq ft | Price per sq ft |
|---|---|---|---|---|---|---|---|
| 1. 8 Cobblestone Court | Jun 22, 2026 | $3,399,000 | $3,400,000 | 100.0% | 67 | 6,937 | $490 |
| 2. 17 Old Church Road | Jul 24, 2026 | $2,975,000 | $2,975,000 | 100.0% | 198 | 5,069 | $587 |
| 3. 17 Countryside Lane | Jul 24, 2026 | $2,850,000 | $2,900,000 | 101.8% | 12 | 6,230 | $465 |
| 4. 10 Twin Brooks Court | Aug 4, 2026 | $2,820,000 | $2,750,000 | 97.5% | 209 | 4,900 | $561 |
| 5. 6 Thistle Lane | May 15, 2026 | $2,595,000 | $2,595,000 | 100.0% | 19 | 5,576 | $465 |
| 6. 6 Stonehedge Court | Apr 27, 2026 | $2,499,000 | $2,485,000 | 99.4% | 9 | 3,883 | $640 |
| 7. 9 Midvale Drive | Jun 30, 2026 | $2,650,000 | $2,450,000 | 92.5% | 27 | 6,630 | $370 |
| 8. 5 Cotswold Lane | Jun 17, 2026 | $2,350,000 | $2,405,000 | 102.3% | 13 | 5,268 | $457 |
| 9. 21 Rockage Road | Aug 12, 2026 | $2,350,000 | $2,395,000 | 101.9% | 23 | 4,876 | $491 |
| 10. 3 Brookside Drive | Jul 13, 2026 | $2,449,000 | $2,374,000 | 96.9% | 30 | 5,512 | $431 |
| 11. 9 Brookside Drive | Aug 31, 2026 | $2,399,000 | $2,350,000 | 98.0% | 94 | 5,182 | $453 |
| 12. 15 Quail Run | Jun 11, 2026 | $2,250,000 | $2,175,000 | 96.7% | 24 | 5,940 | $366 |
| 13. 19 Glenview Drive | Apr 17, 2026 | $2,000,000 | $2,000,000 | 100.0% | 27 | 6,731 | $297 |
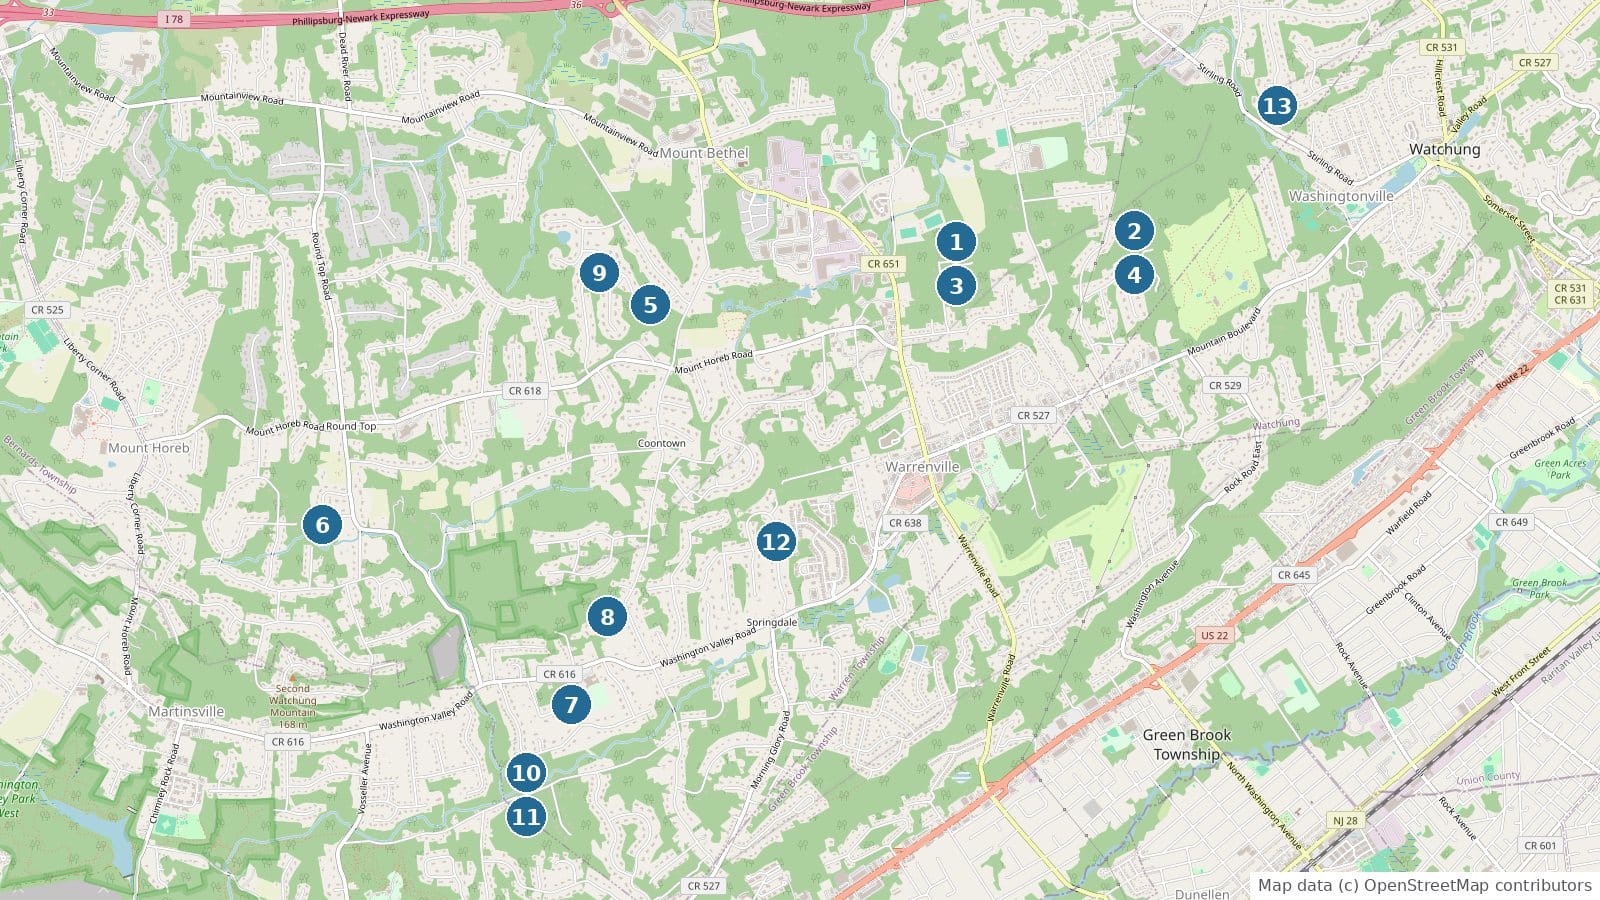
The eighteen between $1,500,000 and $2,000,000
The tier that lost eleven sales from last year. These are its eighteen 2026 closings through October 20, ranked by price. Six closed over ask, the median took 20 days, and the median sale was 98.1 percent of its last asking price. Four of the eighteen had cut the asking price before selling, and two were new construction. The largest premium in the tier was 10 Johns Drive at 115.8 percent of ask, and the longest on market 3 Upper Warren Way at 244 days.
| Home | Closed | Last asking price | Sale price | Percent of ask | Days on market | Living area, sq ft | Price per sq ft |
|---|---|---|---|---|---|---|---|
| 1. 51 Washington Valley Road | Jan 2, 2026 | $1,995,000 | $1,999,999 | 100.3% | 18 | 4,763 | $420 |
| 2. 2 Willow Woods Trail | Mar 13, 2026 | $1,999,000 | $1,960,000 | 98.0% | 81 | 5,893 | $333 |
| 3. 1 Providence Road | May 15, 2026 | $1,898,000 | $1,954,999 | 103.0% | 9 | 4,449 | $439 |
| 4. 5 Longford Court | Jun 22, 2026 | $1,950,000 | $1,900,000 | 97.4% | 11 | 3,897 | $488 |
| 5. 17 Sugarwood Way | Sep 4, 2026 | $1,799,000 | $1,900,000 | 105.6% | 12 | 3,961 | $480 |
| 6. 14 Broadway Road | Mar 20, 2026 | $1,899,999 | $1,825,000 | 96.1% | 169 | 4,873 | $375 |
| 7. 7 Manor Drive | Apr 16, 2026 | $1,699,000 | $1,700,000 | 100.1% | 8 | 3,519 | $483 |
| 8. 5 Meadow Drive | Aug 24, 2026 | $1,695,000 | $1,700,000 | 100.3% | 20 | 3,750 | $453 |
| 9. 7 Nottingham Way | Sep 1, 2026 | $1,799,900 | $1,700,000 | 94.4% | 118 | 5,525 | $308 |
| 10. 17 Elmwood Drive | Aug 7, 2026 | $1,749,900 | $1,683,780 | 96.2% | 48 | 3,811 | $442 |
| 11. 18 Avon Road | Jan 27, 2026 | $1,650,000 | $1,650,000 | 100.0% | 20 | 4,855 | $340 |
| 12. 57 Briarwood Drive | Jul 23, 2026 | $1,795,000 | $1,650,000 | 91.9% | 90 | 4,194 | $393 |
| 13. 3 Upper Warren Way | Mar 6, 2026 | $1,590,000 | $1,590,000 | 100.0% | 244 | 3,699 | $430 |
| 14. 13 Sycamore Way | May 29, 2026 | $1,599,000 | $1,566,000 | 97.9% | 90 | 3,204 | $489 |
| 15. 15 Mundy Lane | May 29, 2026 | $1,625,000 | $1,550,000 | 95.4% | 15 | 4,024 | $385 |
| 16. 1 Bailiwick Drive | Aug 27, 2026 | $1,585,000 | $1,550,000 | 97.8% | 14 | 2,694 | $575 |
| 17. 10 Johns Drive | Oct 2, 2026 | $1,325,000 | $1,535,000 | 115.8% | 8 | 2,639 | $582 |
| 18. 22 Old Dutch Road | Feb 17, 2026 | $1,548,000 | $1,520,000 | 98.2% | 75 | 4,162 | $365 |
The eleven of 2025, for comparison
The eleven sales at $2,000,000 or more in the same window of 2025, January 1 to October 20, ranked by price. Four closed over ask, the median took 55 days, and the longest on market, 2 Twin Brooks Court, was a house sold before it was built, 349 days on market. The highest 2025 sale was 1 Meyers Lane at $2,550,000 against 8 Cobblestone Court at $3,400,000 this year.
| Home | Closed | Last asking price | Sale price | Percent of ask | Days on market | Living area, sq ft | Price per sq ft |
|---|---|---|---|---|---|---|---|
| 1. 1 Meyers Lane | Jun 11, 2025 | $2,599,000 | $2,550,000 | 98.1% | 63 | 5,431 | $470 |
| 2. 2 Twin Brooks Court | Mar 21, 2025 | $2,500,000 | $2,475,000 | 99.0% | 349 | 4,813 | $514 |
| 3. 18 Quail Run | Sep 5, 2025 | $2,750,000 | $2,441,500 | 88.8% | 152 | n/a | n/a |
| 4. 12 Gregory Lane | Apr 10, 2025 | $2,350,000 | $2,400,000 | 102.1% | 80 | 5,082 | $472 |
| 5. 6 Stonehedge Court | May 12, 2025 | $2,200,000 | $2,398,750 | 109.0% | 23 | 3,883 | $618 |
| 6. 10 Jessica Lane | May 30, 2025 | $2,450,000 | $2,356,250 | 96.2% | 8 | 4,912 | $480 |
| 7. 28 Old Forge Drive | Oct 15, 2025 | $2,650,000 | $2,350,000 | 88.7% | 127 | n/a | n/a |
| 8. 8 Stratford Court | Aug 4, 2025 | $2,200,000 | $2,345,000 | 106.6% | 15 | 5,228 | $449 |
| 9. 35 Geiger Lane | Aug 15, 2025 | $2,350,000 | $2,273,700 | 96.8% | 55 | 5,646 | $403 |
| 10. 29 Sandalwood Drive | Apr 30, 2025 | $2,025,000 | $2,100,000 | 103.7% | 9 | 3,766 | $558 |
| 11. 3 Kensington Court | Feb 13, 2025 | $2,150,000 | $2,015,000 | 93.7% | 46 | 5,377 | $375 |
All figures come from Garden State MLS closed sale and listing records for Warren Township, Somerset County, read October 21, 2026, filtered to exclude superseded listing records and counting each MLS number once. The most recent closing in the record is October 20, 2026, which is the last recorded closing and not the date the record was refreshed. Warren Township is in Somerset County and is not Warren County. Sales under $200,000 are excluded as likely not arm's length, which is why the totals here, 132 and 143, run one and two below the unfiltered counts of 133 and 145, and why the twelve month total is 167 rather than 168. The record carries only a handful of Warren sales before 2000, so comparisons start that year. Days on market count the current listing only. Percent of ask compares the sale price with the last list price on the record. New listing counts treat a home that was withdrawn and relisted under a new MLS number as two listings, and listings withdrawn in the last few weeks may not yet carry that status. Dollar figures are nominal and not adjusted for inflation. These figures cover every residential property type in the MLS, including townhouses and condominiums, not detached houses alone. Attached product sells below detached in Warren, so a detached only median would run higher. Every 2026 sale at $1,500,000 or more was a detached single family house.
The MLS record does not say why fewer homes listed between $1,500,000 and $2,000,000 this year, so I cannot tell you whether owners held off, priced above the band, or sold privately. Sales that never went through the MLS, including private sales at the top of the market, do not appear in any count here. The record also does not show how many of the 30 new listings above $2,000,000 are new construction, so the listing side is not split that way. The sales are, by the year built on each record.
Figures are deemed reliable but are not warranted. Nothing here is a valuation of any particular property.
- Garden State MLS closed sale and listing records for Warren Township, Somerset County, read October 21, 2026. https://www.gsmls.com
- Warren, Local., the market page, monthly record since January 2025, updated in place as months close. https://blog.johnmangini.com/warren-real-estate-market/#monthly-record
- Warren, Local., September 2026 market recap, October 14, 2026. https://blog.johnmangini.com/september-2026-market-recap/
- Warren, Local., the conforming loan ceiling and Warren sales, August 21, 2026. https://blog.johnmangini.com/warren-conforming-loan-ceiling/
- Garden State MLS closed sale records for Warren Township, Somerset County, one record per MLS number, read October 21, 2026, for the addresses, prices, dates and days on market in the homes behind the numbers. https://www.gsmls.com
- New Jersey MOD-IV property tax records for Warren Township, matched to each sale by block and lot, for living area, year built, lot size and assessment. https://www.nj.gov/treasury/taxation/lpt/localtax.shtml
- Garden State MLS IDX feed, the listing photo and coordinates for each sale. Photos are the listing photos from the MLS record.
Thinking about selling a Warren home?
Get a property specific analysis built from the same Warren sales database behind this article.
Request a Warren home analysis or call 732.236.1087
Start with what seven years of Warren data says about selling.

John Mangini
Broker / Owner, NextHome Premier
Warren Township resident and full time broker, licensed in New Jersey since 2002. Warren, Local. is written from live Garden State MLS data, township records and primary sources. Every figure is traceable to a source listed above.