Fifteen homes closed in Warren in September at a $1,250,000 median, and 2026 now trails 2025 by ten closings
Fifteen September closings at a $1,250,000 median, the same median as last September on 25 sales. Through September, 2026 has 124 closings to 2025's 134.


This story updates the market tape, the running file that carries the current status.
The figures below are as first published on October 14, 2026, and the record holds the same 15 September closings on October 21. This version adds every September closing by address, with the listing photo and the public record, in the section headed The fifteen homes that closed in September. I have taken out the opinion section. Everything that remains is the record.
Fifteen homes closed in Warren Township in September 2026 at a median price of $1,250,000, over a median 23 days on market and at a median 100.0 percent of the last asking price, with nine of the fifteen closing at or over ask. September 2025 closed 25 homes, the busiest month of 2025, at the same $1,250,000 median. The ten sale gap ended the tie with last year: through September 30, Warren has 124 closings in 2026 against 134 in the same period of 2025, at a year to date median of $1,215,000 against $1,171,950.
The month
| September 2026 | September 2025 | |
|---|---|---|
| Closings | 15 | 25 |
| Median price | $1,250,000 | $1,250,000 |
| Average price | $1,203,633 | $1,256,266 |
| Median days on market | 23 | 21 |
| Median percent of ask | 100.0 | 101.6 |
| Average percent of ask | 100.7 | 100.3 |
| Closed at or over ask | 9 of 15 | 15 of 25 |
| Low sale | $735,000 | $475,000 |
| High sale | $1,900,000 | $2,441,500 |
| Dollar volume | $18,054,500 | $31,406,650 |
| Detached houses | 15 | 20 |
| Townhouses and condominiums | 0 | 4 |
| Property type not recorded | 0 | 1 |
Percent of ask compares the sale price with the list price in effect when the contract was signed. Days on market count the current listing only. A fifteen sale month is a small sample, and one closing moves most rows in this table. Read the direction, not the decimals.
Same median, different month
The two Septembers share a median to the dollar, and that is close to a coincidence. Last month's recap showed how the blended median swings with the mix of property types. This September runs the other way. Every one of the fifteen sales was a detached house, while last September carried four townhouses and condominiums. Compare detached with detached, and September 2026 ran $1,250,000 against $1,297,500, down $47,500 or 3.7 percent.
| Segment | Sep 2026 sales | Sep 2026 median | Sep 2025 sales | Sep 2025 median |
|---|---|---|---|---|
| Detached houses | 15 | $1,250,000 | 20 | $1,297,500 |
| Townhouses and condominiums | 0 | none | 4 | $1,225,000 |
| All residential types | 15 | $1,250,000 | 25 | $1,250,000 |
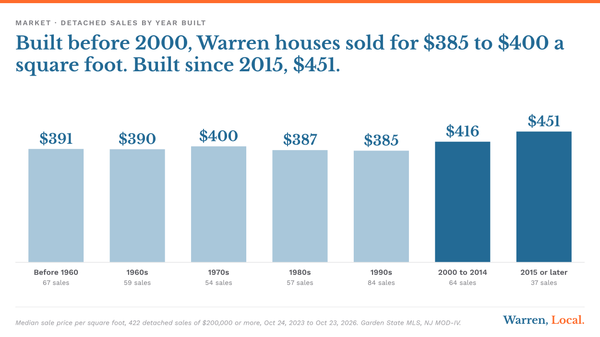
Unlike August, this month has a per foot figure. All fifteen September sales carry a living area from county parcel records, so the per foot median covers the whole month: $400 a square foot. The detached houses that closed in September 2025 ran $419 on the 19 with a living area on the same basis, so the per foot measure points the same way as the detached median, down 4.7 percent. The top of the month was lower too. The highest September 2026 sale was $1,900,000, against $2,441,500 a year earlier, and no September 2026 sale closed above $2 million.
The negotiating figures moved a little against sellers and stayed close to even. The median sale closed at exactly ask, against 101.6 percent last September, and nine of fifteen met or beat the ask, against fifteen of twenty five. For the longer view of sales over asking, see how often Warren homes sold over ask this year.
Where the ten closings went
Most September closings come from contracts signed in July and August. The number of those contracts barely changed. What changed is how many reached the closing table inside September.
| Contracts and closings | 2026 | 2025 |
|---|---|---|
| Contracts signed in July and August | 33 | 34 |
| Of those, closed in September | 11 | 20 |
| Of those, still under contract on October 14 | 8 | not applicable |
| Contracts signed in September | 17 | 12 |
| Median days from contract to closing, September closings | 35 | 44 |
Thirty three contracts signed in July and August 2026 against thirty four a year earlier, and seventeen signed in September against twelve. Eight of this summer's contracts are still open on October 14, and fifteen of September's seventeen are open as well. Those homes have not left the pipeline, they have not closed yet. The sales that did close in September moved from contract to deed faster than last year, a median 35 days against 44, so the shortfall is not explained by slower closings across the board. The record does not say why a given contract is still open.
Contract counts include only listings that later closed or are still under contract. A contract that fell through and returned to the market is not counted, so each count is a floor. The count of contracts by month comes from the pending date on each listing, read October 14.
Supply
Twenty new listings came on in September 2026, against 26 in September 2025. Their median original asking price was $1,650,000, against $1,223,000 for last September's 26. As of October 14, Warren has 31 active listings at a median asking price of $1,460,000 and 29 homes under contract. At the pace of the twelve months through September, 170 closings or about 14 a month, that is 2.2 months of supply. The twelve months through September 2025 had 186 closings.
The year to date
| January 1 to September 30 | 2026 | 2025 |
|---|---|---|
| Closings | 124 | 134 |
| Median price, all types | $1,215,000 | $1,171,950 |
| Median, detached houses | $1,300,000 on 102 | $1,195,000 on 105 |
| Median, townhouses and condominiums | $835,000 on 21 | $695,840 on 26 |
| Dollar volume | $156,931,186 | $160,627,741 |
| Median days on market | 23 | 21 |
| Median percent of ask | 100.0 | 100.0 |
| Closed at or over ask | 65 of 124 | 73 of 134 |
The two years were tied at 109 closings through August. September broke the tie, and 2026 now trails by ten closings, 7.5 percent. Dollar volume is down 2.3 percent, from $160,627,741 to $156,931,186. Prices held. The year to date median is up 3.7 percent, detached houses are up 8.8 percent, from $1,195,000 to $1,300,000, and townhouses and condominiums are up 20.0 percent, from $695,840 to $835,000, on small counts. Each segment total leaves out one sale in 2026 and three in 2025 whose property type is not recorded.
| 2026, by month | Closings | Median price | Median days | Median % of ask |
|---|---|---|---|---|
| January | 22 | $1,070,675 | 26 | 99.8 |
| February | 4 | $1,032,500 | 54 | 99.1 |
| March | 14 | $913,500 | 73 | 99.1 |
| April | 10 | $1,065,000 | 23 | 101.6 |
| May | 12 | $1,300,000 | 17 | 99.1 |
| June | 14 | $1,325,000 | 19 | 99.8 |
| July | 17 | $1,300,000 | 21 | 99.6 |
| August | 16 | $1,234,500 | 24 | 99.8 |
| September | 15 | $1,250,000 | 23 | 100.0 |
Median days are rounded to whole days where the median falls between two sales. The August count of 16 printed in last month's recap has held. September's 15 can still rise as late closings report to the MLS, and the monthly record on the market page carries the current count.
The fifteen homes that closed in September
Every September closing, ranked by price, with the listing photo and the public record. Fifteen were detached houses. None of the 15 were new construction by the year built on the listing, 2024 or later. Six closed over the last asking price, three at it and six under it. Three had cut the asking price before the contract, and five closed without a mortgage on the record. The highest was 17 Sugarwood Way at $1,900,000 and the lowest 43 King George Road at $735,000. The longest on market was 7 Nottingham Way, 118 days.
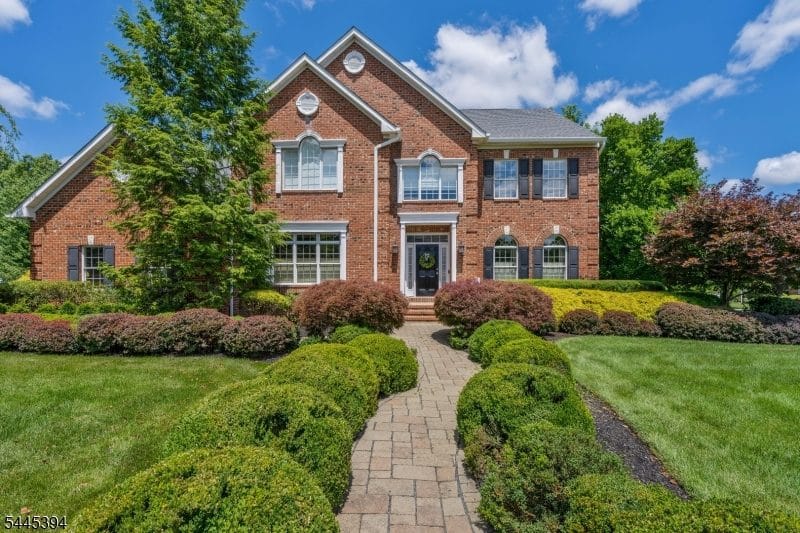
17 Sugarwood Way
$1,900,000
Closed September 4, 2026 at 105.6 percent of a $1,799,000 ask, 12 days on market.
4 bedrooms, 2 full baths, 2 half baths, 3,961 sq ft, built 2001, 0.74 acres
Image from Garden State MLS listing 4039627.
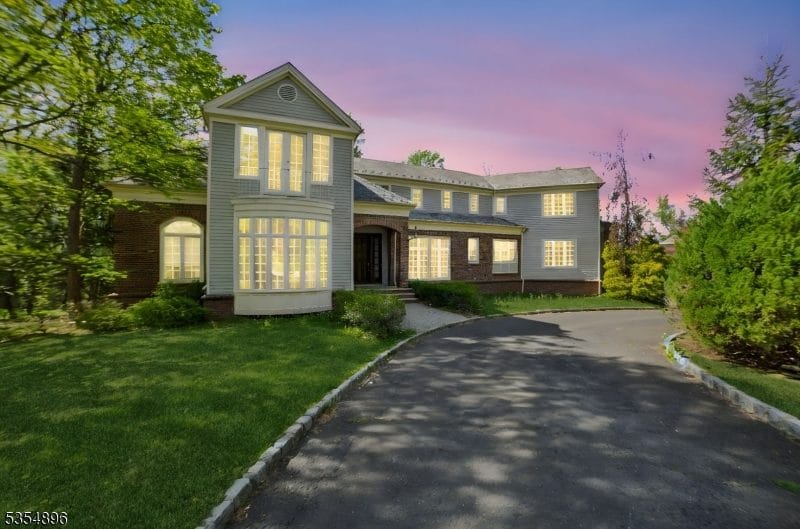
7 Nottingham Way
$1,700,000
Closed September 1, 2026 at 94.4 percent of a $1,799,900 ask, 118 days on market.
5 bedrooms, 5 full baths, 1 half bath, 5,525 sq ft, built 1988, 1.02 acres
Image from Garden State MLS listing 3960455.
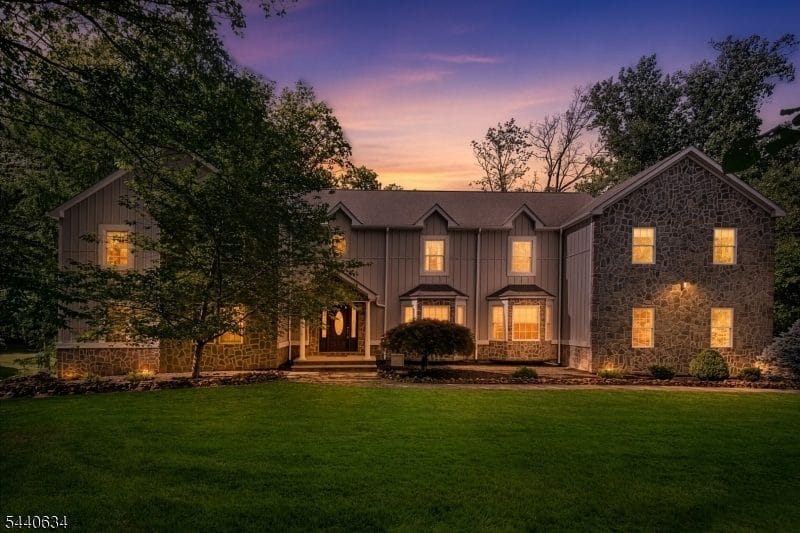
21 Angus Lane
$1,480,000
Closed September 10, 2026 at 100.0 percent of a $1,480,000 ask, 62 days on market.
6 bedrooms, 4 full baths, 2 half baths, 4,820 sq ft, built 1969, 1.50 acres
Image from Garden State MLS listing 4035284.
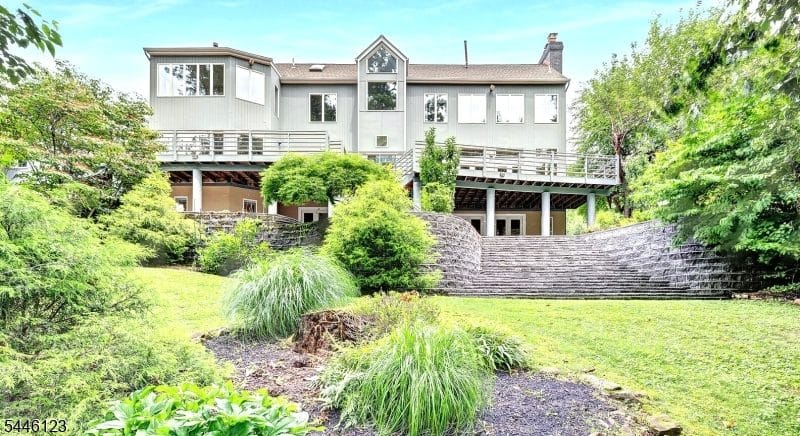
30 Ellsworth Drive
$1,450,000
Closed September 2, 2026 at 100.0 percent of a $1,450,000 ask, 15 days on market.
4 bedrooms, 3 full baths, 1 half bath, 3,976 sq ft, built 1987, 1.51 acres
Image from Garden State MLS listing 4040459.
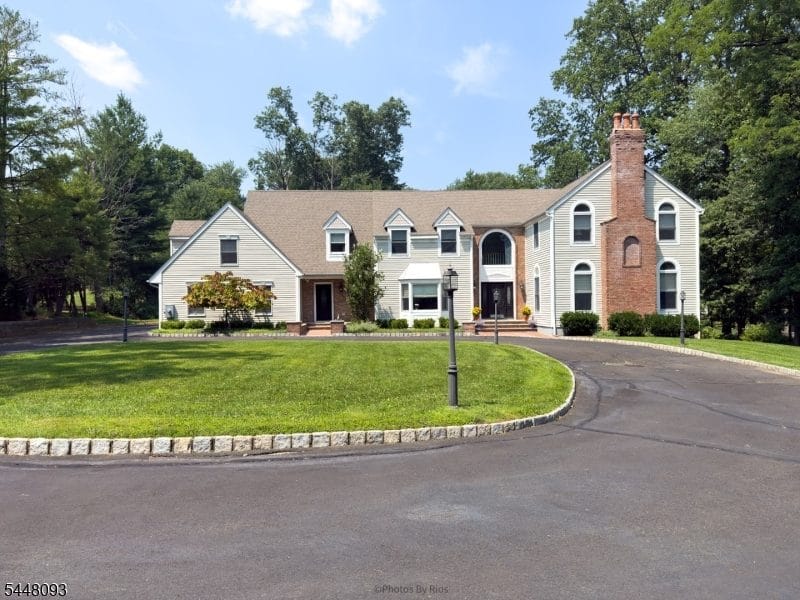
21 Round Top Road
$1,365,000
Closed September 16, 2026 at 97.5 percent of a $1,400,000 ask, 23 days on market.
5 bedrooms, 5 full baths, 1 half bath, 4,075 sq ft, built 1990, 2.30 acres
Image from Garden State MLS listing 4041938.
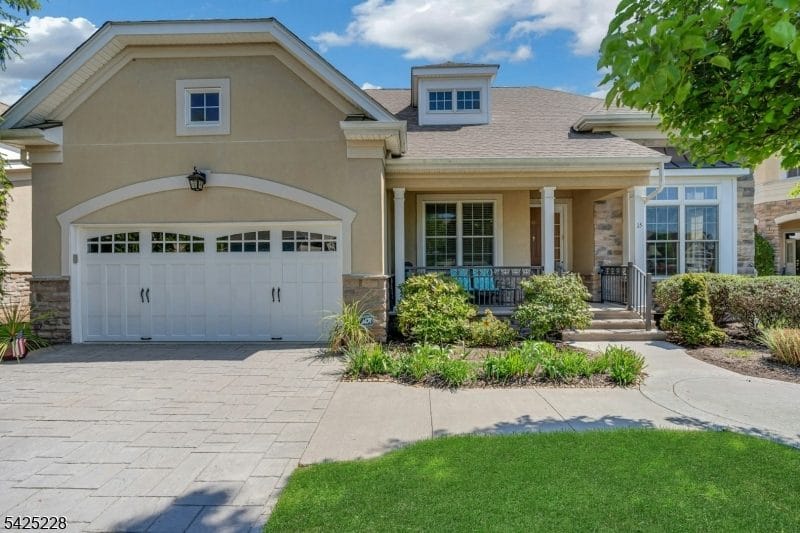
15 Johns Drive
$1,353,000
Closed September 30, 2026 at 108.2 percent of a $1,250,000 ask, 7 days on market.
2 bedrooms, 3 full baths, 1 half bath, 2,503 sq ft, built 2011, 0.19 acres
Image from Garden State MLS listing 4026341.
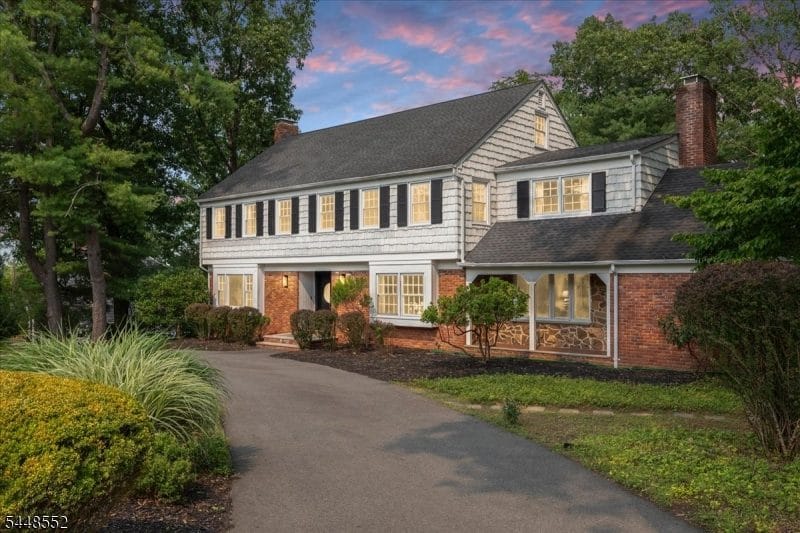
20 Gregory Lane
$1,300,000
Closed September 3, 2026 at 108.3 percent of a $1,199,999 ask, 12 days on market.
5 bedrooms, 4 full baths, 1 half bath, 3,253 sq ft, built 1972, 1.70 acres
Image from Garden State MLS listing 4042524.
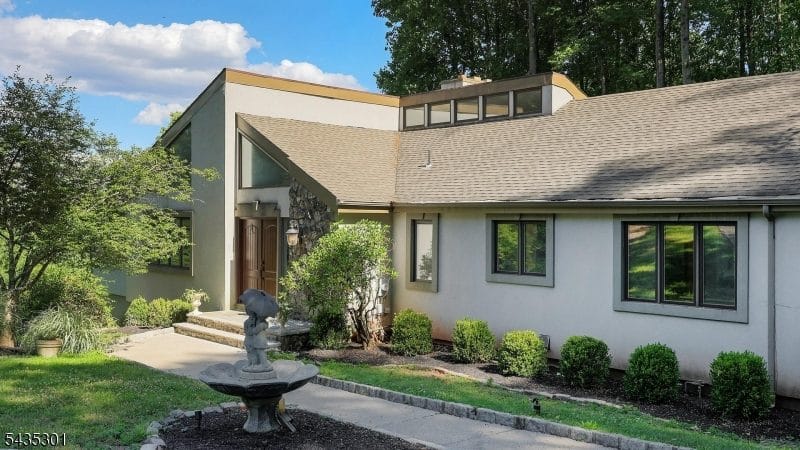
2 Springdale Lane
$1,250,000
Closed September 30, 2026 at 89.3 percent of a $1,399,000 ask, 66 days on market.
4 bedrooms, 3 full baths, 1 half bath, 2,750 sq ft, built 1986, 1.51 acres
Image from Garden State MLS listing 4038478.
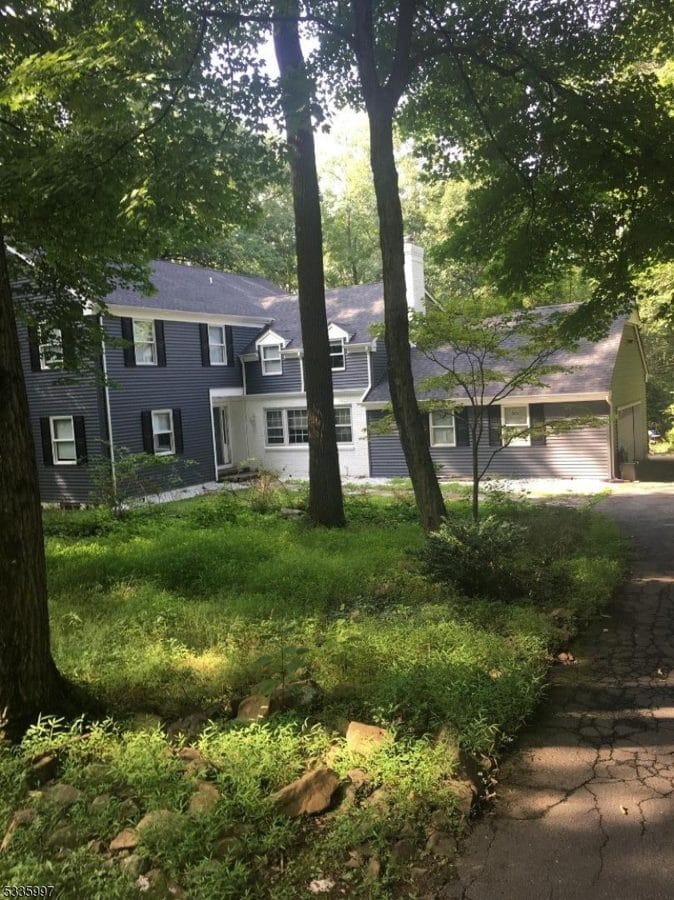
14 Sunrise Drive
$1,175,000
Closed September 17, 2026 at 94.0 percent of a $1,250,000 ask, 67 days on market.
4 bedrooms, 3 full baths, 2 half baths, 3,148 sq ft, built 1966, 1.93 acres
Image from Garden State MLS listing 4032868.
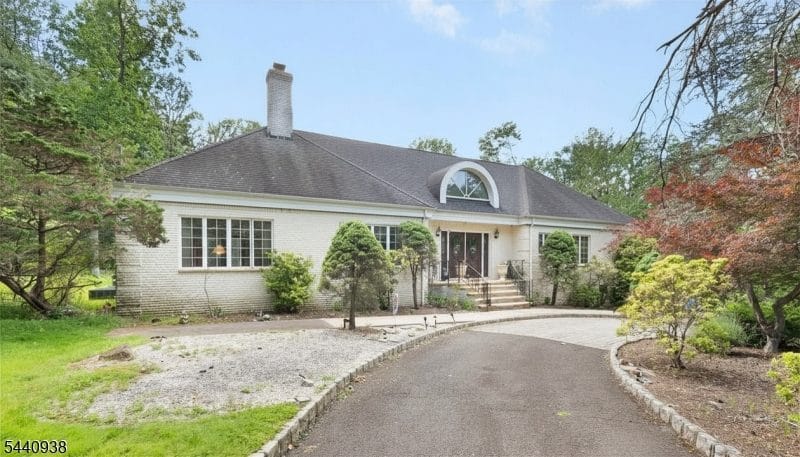
10 Loriann Road
$1,130,000
Closed September 29, 2026 at 94.2 percent of a $1,200,000 ask, 70 days on market.
4 bedrooms, 4 full baths, 1 half bath, 3,204 sq ft, built 1968, 1.50 acres
Image from Garden State MLS listing 4035505.
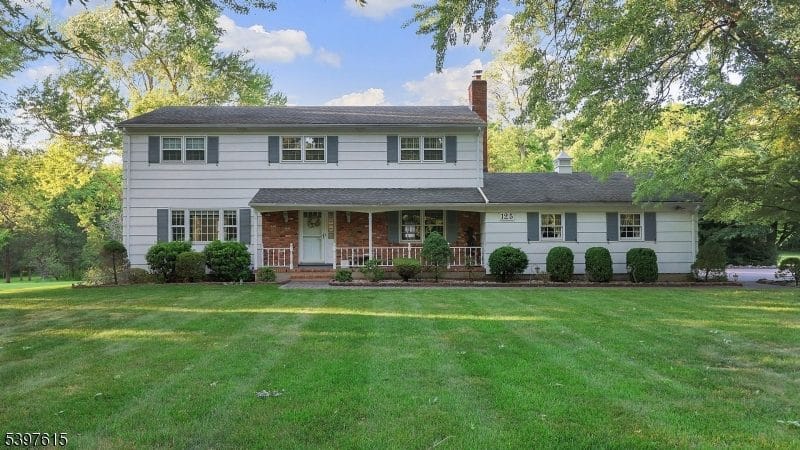
125 Mountainview Road
$900,000
Closed September 16, 2026 at 95.2 percent of a $944,888 ask, 9 days on market.
4 bedrooms, 2 full baths, 1 half bath, 2,302 sq ft, built 1970, 1.50 acres
Image from Garden State MLS listing 4047839.
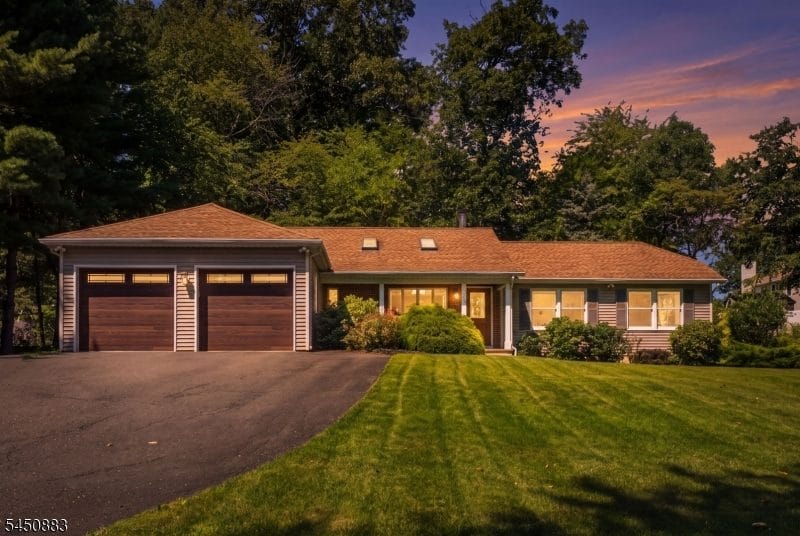
59 Morning Glory Road
$826,500
Closed September 24, 2026 at 114.0 percent of a $725,000 ask, 9 days on market.
3 bedrooms, 2 full baths, 1,614 sq ft, built 1992, 0.51 acres
Image from Garden State MLS listing 4045357.
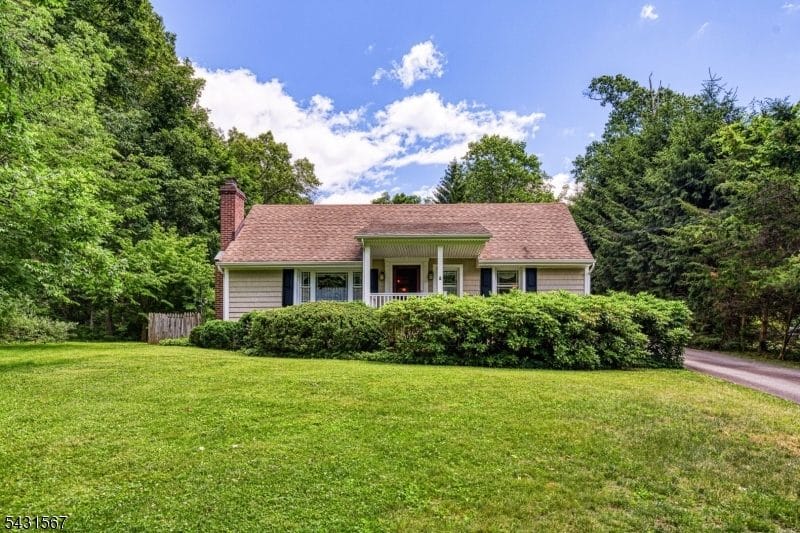
28 Saw Mill Road
$750,000
Closed September 22, 2026 at 103.4 percent of a $725,000 ask, 11 days on market.
3 bedrooms, 2 full baths, 1,801 sq ft, built 1965, 1.70 acres
Image from Garden State MLS listing 4035763.
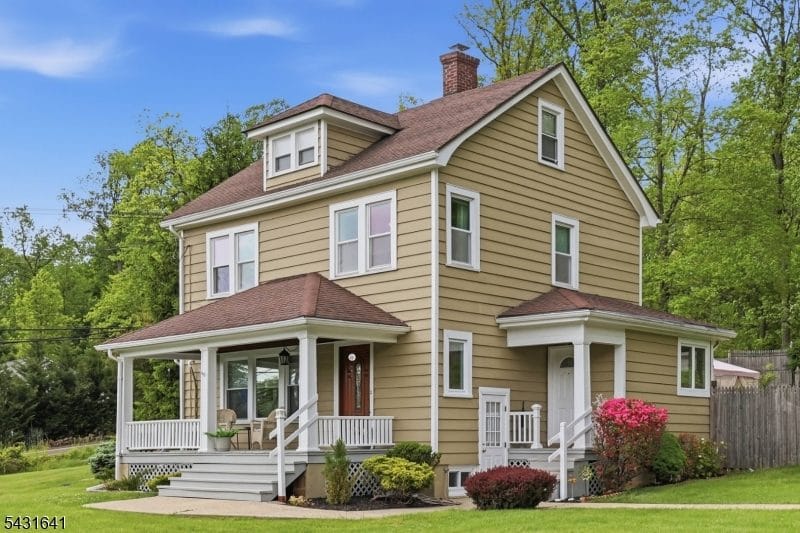
59 Mount Horeb Road
$740,000
Closed September 3, 2026 at 105.9 percent of a $699,000 ask, 68 days on market.
3 bedrooms, 2 full baths, 1,440 sq ft, built 1931, 2.92 acres
Image from Garden State MLS listing 4027593.
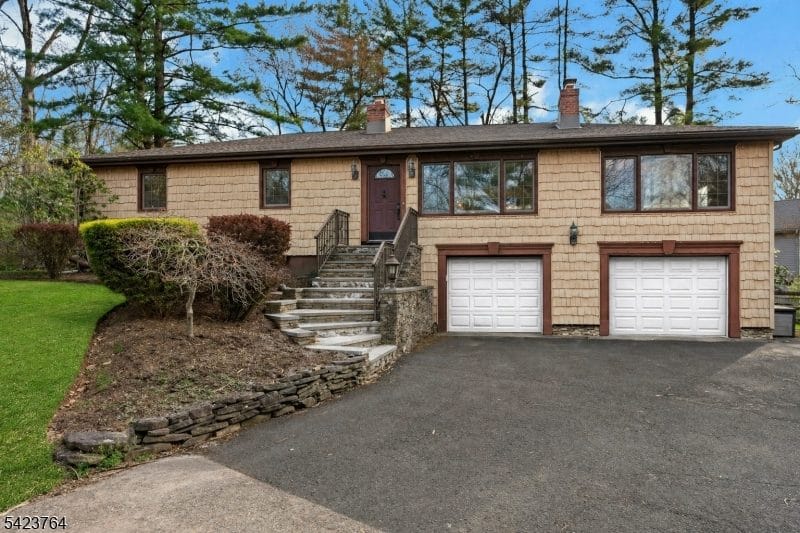
43 King George Road
$735,000
Closed September 21, 2026 at 100.0 percent of a $735,000 ask, 83 days on market.
3 bedrooms, 2 full baths, 1,740 sq ft, built 1957, 2.01 acres
Image from Garden State MLS listing 4024373.
The same fifteen in one table. Percent of ask compares the sale price with the last asking price on the record. Living area is the county parcel figure where the record has one and the listing's own figure for new construction and where the parcel has none, so the per foot column can differ from the $400 median above, which uses the site's broad basis.
| Home | Type | Closed | Last asking price | Sale price | Percent of ask | Days on market | Living area, sq ft | Price per sq ft |
|---|---|---|---|---|---|---|---|---|
| 1. 17 Sugarwood Way | Detached | Sep 4, 2026 | $1,799,000 | $1,900,000 | 105.6% | 12 | 3,961 | $480 |
| 2. 7 Nottingham Way | Detached | Sep 1, 2026 | $1,799,900 | $1,700,000 | 94.4% | 118 | 5,525 | $308 |
| 3. 21 Angus Lane | Detached | Sep 10, 2026 | $1,480,000 | $1,480,000 | 100.0% | 62 | 4,820 | $307 |
| 4. 30 Ellsworth Drive | Detached | Sep 2, 2026 | $1,450,000 | $1,450,000 | 100.0% | 15 | 3,976 | $365 |
| 5. 21 Round Top Road | Detached | Sep 16, 2026 | $1,400,000 | $1,365,000 | 97.5% | 23 | 4,075 | $335 |
| 6. 15 Johns Drive | Detached | Sep 30, 2026 | $1,250,000 | $1,353,000 | 108.2% | 7 | 2,503 | $541 |
| 7. 20 Gregory Lane | Detached | Sep 3, 2026 | $1,199,999 | $1,300,000 | 108.3% | 12 | 3,253 | $400 |
| 8. 2 Springdale Lane | Detached | Sep 30, 2026 | $1,399,000 | $1,250,000 | 89.3% | 66 | 2,750 | $455 |
| 9. 14 Sunrise Drive | Detached | Sep 17, 2026 | $1,250,000 | $1,175,000 | 94.0% | 67 | 3,148 | $373 |
| 10. 10 Loriann Road | Detached | Sep 29, 2026 | $1,200,000 | $1,130,000 | 94.2% | 70 | 3,204 | $353 |
| 11. 125 Mountainview Road | Detached | Sep 16, 2026 | $944,888 | $900,000 | 95.2% | 9 | 2,302 | $391 |
| 12. 59 Morning Glory Road | Detached | Sep 24, 2026 | $725,000 | $826,500 | 114.0% | 9 | 1,614 | $512 |
| 13. 28 Saw Mill Road | Detached | Sep 22, 2026 | $725,000 | $750,000 | 103.4% | 11 | 1,801 | $416 |
| 14. 59 Mount Horeb Road | Detached | Sep 3, 2026 | $699,000 | $740,000 | 105.9% | 68 | 1,440 | $514 |
| 15. 43 King George Road | Detached | Sep 21, 2026 | $735,000 | $735,000 | 100.0% | 83 | 1,740 | $422 |
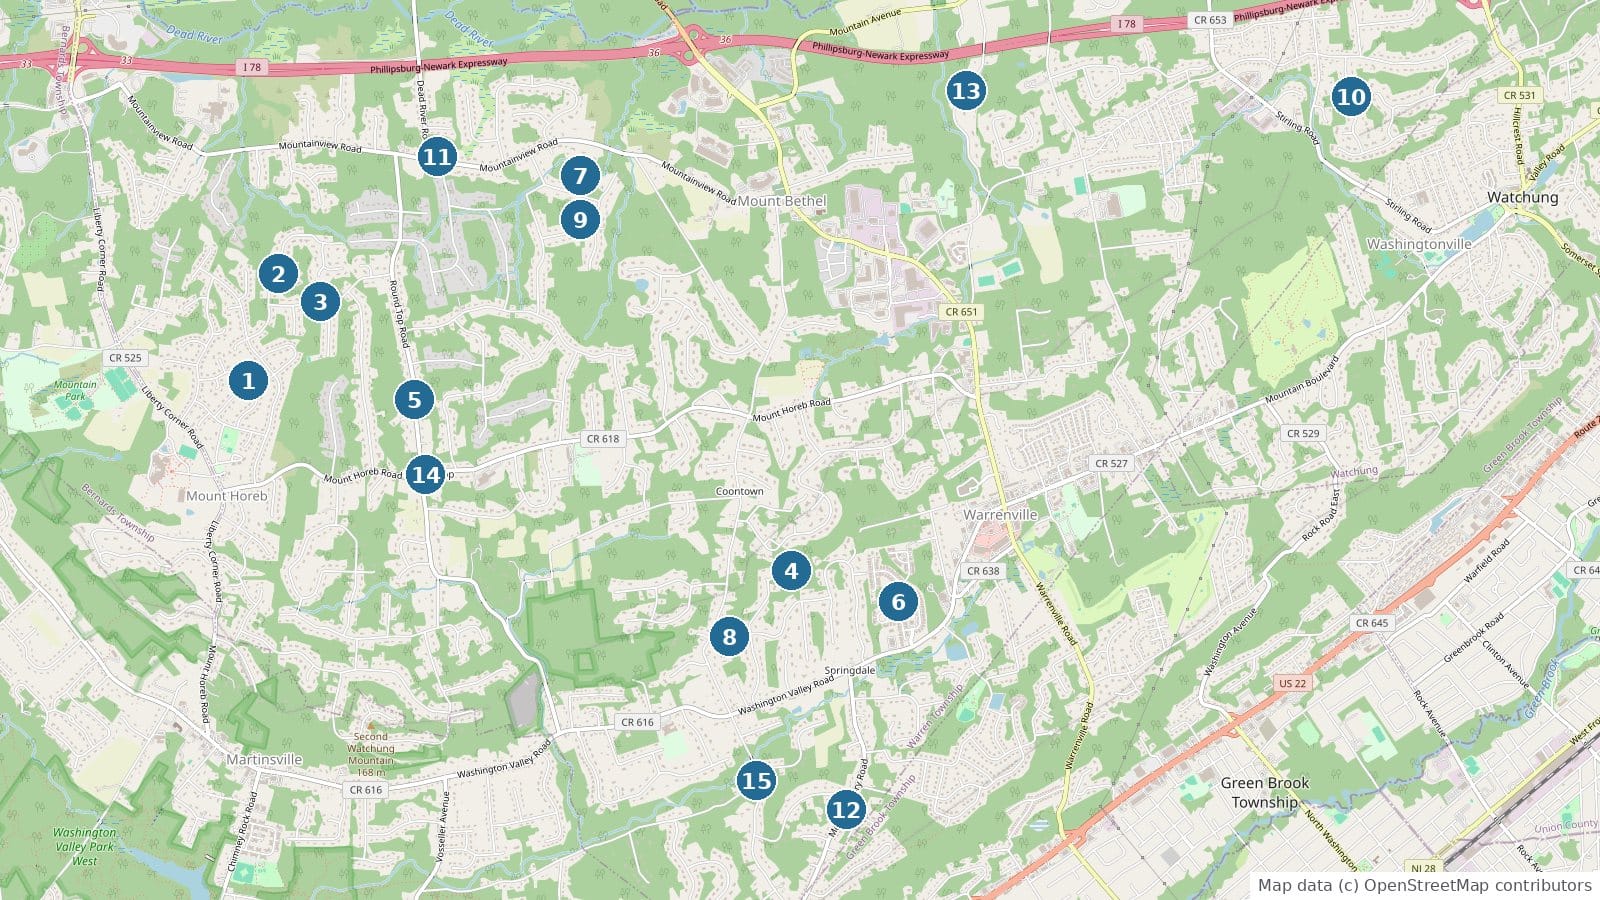
All figures come from Garden State MLS closed sale and listing records for Warren Township, Somerset County, read October 14, 2026, filtered to exclude superseded listing records. The most recent closing in the record is October 9, 2026, which is the last recorded closing and not the date the record was refreshed. Warren Township is in Somerset County and is not Warren County. Days on market reflects the current listing only. Sales that never went through the MLS do not appear. Percent of ask compares sale price to the list price in effect at contract, not to the original asking price. Medians in an even count are the midpoint of the two middle sales. No price floor is applied, and every September 2026 sale was above $200,000. Per foot figures use county parcel living area where it exists and the listing's approximate figure otherwise, exclude results outside $50 to $1,500 a foot, and cover all 15 September 2026 sales, 22 of the 25 September 2025 sales and 19 of last September's 20 detached sales. These figures cover every residential property type in the MLS, including townhouses and condominiums, not detached houses alone. Attached product sells below detached in Warren, so a detached only median would run higher.
The MLS record does not say why eight July and August contracts are still open, so I cannot tell you whether they reflect new construction, financing, or buyers and sellers who chose a later date. Contracts that fell apart are not in any count here, so I cannot say whether more deals failed this summer than last. September 2026 had no townhouse or condominium closings, so this post says nothing about that segment's September prices.
Figures are deemed reliable but are not warranted. Nothing here is a valuation of any particular property.
- Garden State MLS closed sale and listing records for Warren Township, Somerset County, read October 14, 2026. https://www.gsmls.com
- Warren, Local., the market page, monthly record since January 2025, updated in place as months close. https://blog.johnmangini.com/warren-real-estate-market/#monthly-record
- Warren, Local., August 2026 market recap, September 9, 2026. https://blog.johnmangini.com/august-2026-market-recap/
- Warren, Local., third quarter closings and contracts, September 23, 2026. https://blog.johnmangini.com/warren-third-quarter-closings-contracts/
- Warren, Local., homes sold over asking in 2026, September 30, 2026. https://blog.johnmangini.com/warren-homes-sold-over-asking-2026/
- Garden State MLS closed sale records for Warren Township, Somerset County, one record per MLS number, read October 21, 2026, for the addresses, prices, dates and days on market in the homes behind the numbers. https://www.gsmls.com
- New Jersey MOD-IV property tax records for Warren Township, matched to each sale by block and lot, for living area, year built, lot size and assessment. https://www.nj.gov/treasury/taxation/lpt/localtax.shtml
- Garden State MLS IDX feed, the listing photo and coordinates for each sale. Photos are the listing photos from the MLS record.
Thinking about selling a Warren home?
Get a property specific analysis built from the same Warren sales database behind this article.
Request a Warren home analysis or call 732.236.1087
Start with what seven years of Warren data says about selling.

John Mangini
Broker / Owner, NextHome Premier

Warren Township resident and full time broker, licensed in New Jersey since 2002. Warren, Local. is written from live Garden State MLS data, township records and primary sources. Every figure is traceable to a source listed above.