Warren closed 22 homes in January, three times last January, and 11 went at or over ask
January 2026 produced 22 closings against 7 in January 2025, with median days on market falling from 32 to 20. Only 8 new listings were taken all month.

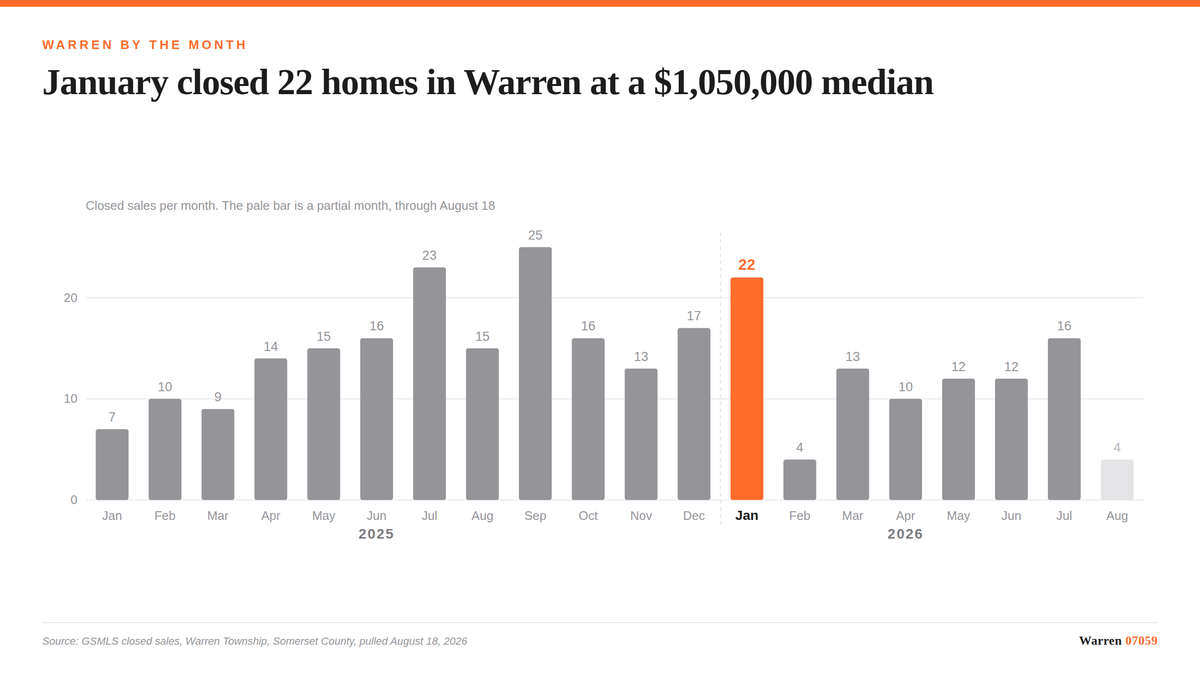
Warren Township recorded 22 closings in January 2026 against 7 in January 2025. Median closed price was $1,050,000, down from $1,160,000 a year earlier, and median days on market fell from 32 to 20. Sellers averaged 100.7 percent of asking price against 98.0 percent in January 2025, and 11 of the 22 sales closed at or above ask, against 3 of 7. Only 8 new listings were taken during the month, the same count as January 2025.
January is the month people misread most often, because the closings that settle in January were mostly negotiated in November and December. What follows is a report on late autumn, delivered in winter.
January 2026 against January 2025
| Measure | Jan 2026 | Jan 2025 |
|---|---|---|
| Closings | 22 | 7 |
| Median closed price | $1,050,000 | $1,160,000 |
| Median days on market | 20 | 32 |
| Average percent of ask | 100.7 | 98.0 |
| Closed at or over ask | 11 of 22 | 3 of 7 |
| New listings taken | 8 | 8 |
Closed prices in January 2026 ranged from $630,000 to $1,999,999.
Volume tripled, and that is the headline
Twenty-two closings against seven is the largest year over year change in this table, and it is not a rounding artifact. Seven closings is a very thin month. Twenty-two is a normal to strong one for Warren in any season.
Two caveats belong right next to that number. First, January 2025 was unusually low, so part of the gap is a weak base rather than a strong present. Second, 22 closings is still a small sample by statistical standards, and a single unusual transaction moves an average in a set that size. The median is the more stable figure here, which is why I lead with it.
The median price fell while competition rose
This is the pairing that confuses people. Median closed price dropped from $1,160,000 to $1,050,000, which reads as a softer market. Every other measure points the other way. Days on market fell from 32 to 20. Average percent of ask rose from 98.0 to 100.7. The share closing at or above ask went from 3 of 7 to 11 of 22.
Median price is a measure of what sold, not of what anything is worth. With seven closings in the base month, the January 2025 median is describing the midpoint of seven houses. It is a composition figure, not a value figure. Read the days on market and percent of ask columns for market condition, and read the median for mix.
What the timing mechanic means
Under normal contract to close timing in New Jersey, a January closing was almost always under contract in November or December. So the competitiveness showing up in these January numbers is a record of what buyers were doing in late 2025, not of what they are doing right now.
That is useful, because November and December closings themselves ran at 96.8 and 97.3 percent of ask. Those months were reporting on contracts from September and October. The step up to 100.7 percent in January is the first month in that sequence to show it.
Eight new listings is the number to watch
Only 8 new listings were taken in Warren during January 2026. That is identical to January 2025 at 8, and it follows December 2025, which produced 6, the thinnest month in the two year record.
So the January 2026 picture is 22 homes leaving the market and 8 entering it. Whether that persists depends on what sellers do in February and March, and nothing in this data tells you that in advance. What it does tell you is that the competitive readings above happened against a very small supply of choices.
All figures are Garden State MLS data for Warren Township in Somerset County, pulled from my BigQuery warehouse on August 18, 2026. They cover transactions reported to GSMLS and exclude private sales and any transaction not entered in the MLS. Days on market is the MLS field and reflects the current listing only, so a property relisted after a withdrawal shows the shorter clock. Percent of ask compares the closed price to the final asking price, not the original one, so a home that reduced twice and then sold can still print above 100 percent. None of this is a valuation of any specific property. These figures cover every residential property type in the MLS, including townhouses and condominiums, not detached houses alone. Attached product sells below detached in Warren, so a detached only median would run higher.
The author's read
The single most informative line in the table is 11 of 22 at or above ask. That is half the month's transactions, and it is a behavior measure rather than a price measure, which makes it harder to distort with mix. In a month with 8 new listings, half of buyers meeting or beating the ask is consistent with a market where the constraint is inventory rather than demand.
What I would not do is extrapolate a price direction from a $1,050,000 median against a seven sale base. The honest statement is that January 2026 moved more houses, faster, closer to ask than January 2025, on the same very small number of new listings, and that the price medians in both months are describing different sets of houses.
February will report on December and January contracts. That is the next real data point.
- GSMLS data for Warren Township, Somerset County, via the author's BigQuery warehouse, pulled August 18, 2026. https://www.gsmls.com
Thinking about selling a Warren home?
Get a property specific analysis built from the same Warren sales database behind this article.
Request a Warren home analysis or call 732.236.1087
Start with what seven years of Warren data says about selling.

John Mangini
Broker / Owner, NextHome Premier
Warren Township resident and full time broker, serving clients since 1999. Warren 07059 is written from live Garden State MLS data, township records and primary sources. Every figure is traceable to a source listed above.